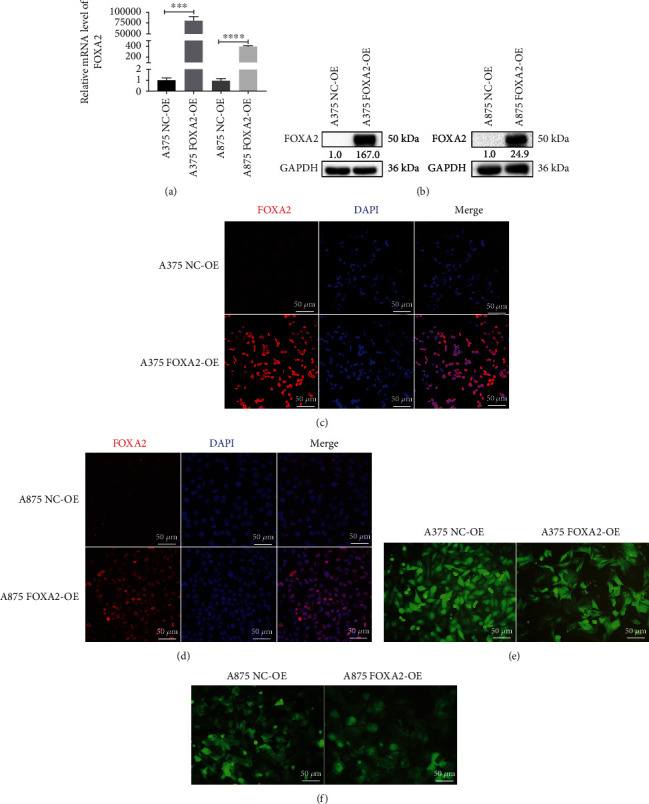
Figure 6.

Establishment and identification of FOXA2 overexpression in melanoma cell lines. (a) RT-qPCR analysis of the relative mRNA expression of FOXA2 in NC-OE and FOXA2-OE melanoma cells. (b) Western blotting analysis of the protein expression of FOXA2 in NC-OE and FOXA2-OE melanoma cells. (c, d) Representative images of immunofluorescence staining for FOXA2 in NC-OE and FOXA2-OE melanoma cells. (e, f) Representative figures show that FOXA2-OE melanoma cells were more cohesive and spatially organized than NC-OE cells. Scale bars = 50 μm. ∗∗∗p < 0.001, ∗∗∗∗p < 0.0001 vs. control cells.
