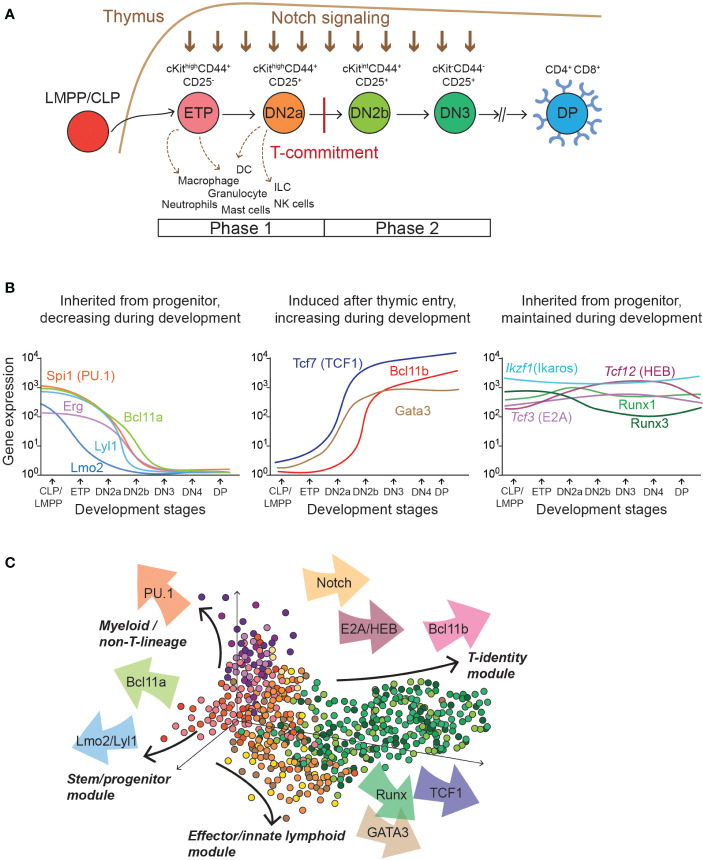
Figure 1.
T cell development stages and transcription factor expression kinetics. (A) Diagram depicts different stages of early thymic T cell development that T-progenitor cells sequentially go through. Informative surface proteins that are utilized to define each stage are indicated (cKit, CD44, CD25 for ETP to DN3; CD4 and CD8 for DP). Developmental plasticity to generate alternative, non-T-lineage cells is shown with dotted arrows. Note that these alternative lineage potentials are silenced after T-lineage commitment. Lineage commitment to a T cell fate distinguishes Phase 1 (before T-lineage commitment) and Phase 2 (after T-lineage commitment). CLP, Common lymphoid progenitor, LMPP, lympho-myeloid primed progenitor. (B) Graphs show mRNA expression kinetics of important transcription factors involved in early T cell gene regulation programs. Left: Transcription factors inherited from the bone-marrow progenitor cells whose expressions gradually decline during T-development (Spi1, Bcl11a, Erg, Lyl1, and Lmo2). Middle: transcription factors upregulated in pro-T cells by thymic microenvironment (Tcf7, Gata3, and Bcl11b). Right: transcription factors expressed from the bone-marrow progenitor cells and stably and maintained during T cell development (Ikzf1, Tcf3, Tcf12, Runx1, and Runx3). Gene expression data was plotted by utilizing publicly available mRNA expression datasets for immune cells with curve smoothing (https://www.immgen.org) (93). (C) Diagram illustrates transcription factors (arrows) providing distinct forces to different gene expression program modules in individual cells.

