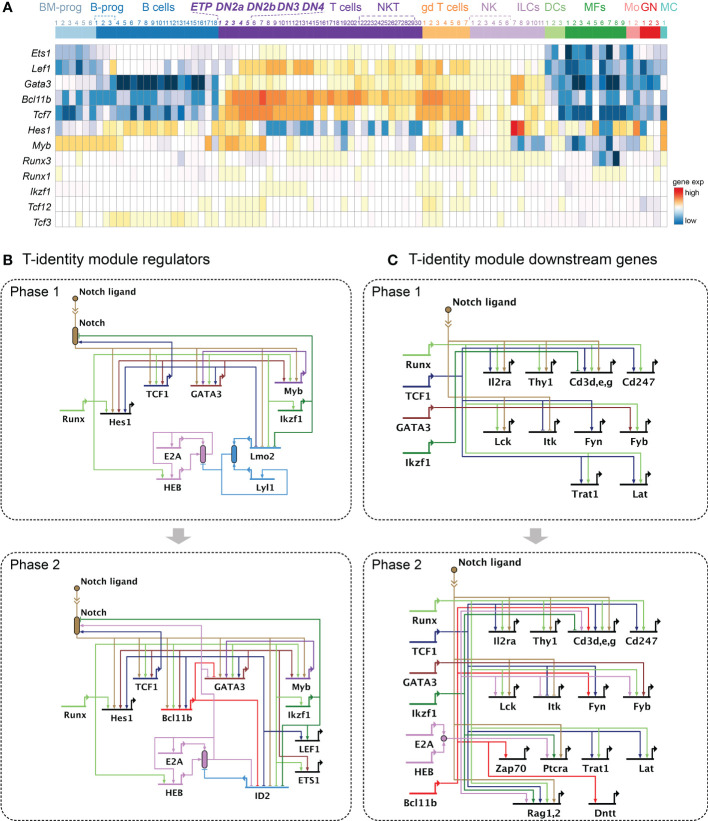
Figure 2.
Gene regulatory networks driving the T-identity module. (A) Heatmap shows expression patterns of key transcription factors supporting the T-identity module across different immune cell types, using the ImmGen MyGeneSet tool (https://www.immgen.org) (93). Bone marrow progenitor (BM progen), B cells precursors (B progen), B cells, T cells, γδ T cells ("gd T cells"), natural killer cells (NK), Innate lymphoid cells (ILC)s, Dendritic cells (DC), Macrophage (MF), Monocyte (Mo), Granulocyte (GN), Mast cell (MC). See Table S2 for the number keys. (B, C) BioTapestry models (71, 117) of gene regulatory network relationships described in the text. Evidence for all connections shown is in Table S1 . Structure of BioTapestry models: Genes are shown with regulatory regions (horizontal lines) distinct from their encoded outputs (bent arrow at “promoter”). Connections with arrows represent positive regulation. Connections ending in blocking lines represent negative regulation. When gene products combine to produce a functional unit, or when activity is not a simple function of transcriptional output, a “bubble” symbol is placed to represent the emergent function from their collective activities. Both negative and positive regulation can impinge on such activity bubbles, e.g. ID factors inhibiting E protein activity without necessarily inhibiting the expression of the E protein coding genes themselves. Double chevron symbol indicates ligand-receptor interactions, here used to represent Notch ligand—Notch interaction as a source of regulatory input to other genes. Arrows consisting of dotted lines show decreasing or weak activities. These conventions are used also in Figures 4B, C , 5B, C . (B) Current model for the T-identity module regulator transcription factors in Phase 1 (top) and Phase 2 (bottom). (C) Current model for the T-identity module downstream molecules in Phase 1 (top) and Phase 2 (bottom). Expression of Il2ra (CD25) indicates developmental progression from ETP to DN2 and DN3 stages in mice. Surface markers: Thy1, Cd3 clusters genes (Cd3d, Cd3e, Cd3g), Cd247; TCR signaling molecules: Lck, Itk, Fyn, Fyn, Trat1, Lat, Zap70, Ptcra; TCR rearrangement molecules: Rag1, Rag2, Dntt.

