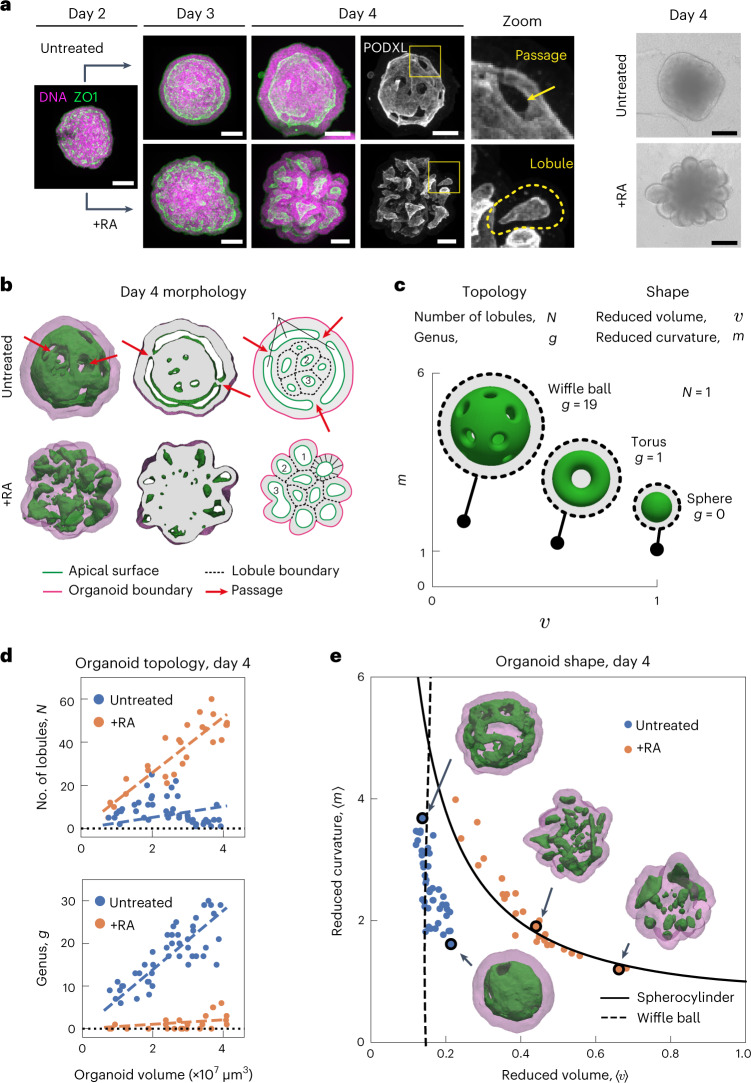
Fig. 1. Topology and shape of neuroepithelial organoids.
a, Neuroepithelial organoids with different morphologies were generated in the presence or absence of RA. Immunofluorescence for ZO1 (green) and PODXL (white) marks the apical membranes. DNA staining (magenta) marks the entire organoid. The images are the maximum intensity projections of volumetric images. Extended Data Fig. 1a shows the images of individual confocal slices. The example of passages on the apical surface (zoom, top row). Example of an epithelial lobule (zoom, bottom row). Bright-field images show the difference in the outer morphology of organoids in the two conditions. b, Organoid morphology is visualized by the surface renderings of the organoid outer boundary (magenta, transparent) and its apical surfaces (green) for day 4 immunostained samples in a. In the cross sections, the grey regions indicate the volume occupied by the cells, whereas the white regions indicate the fluid-filled lumens. The schematic shows how organoids are divided into epithelial lobules annotated with numbers 1, 2 and 3. Extended Data Fig. 1c shows a schematic of the cell-level interpretation of passages. c, Topology of an organoid is quantified by the number of epithelilal lobules N and total genus g. The shape of the organoid is quantified by the average reduced volume 〈v〉 and average reduced curvature 〈m〉, calculated from the values of all the epithelial lobules (Extended Data Fig. 2c, Methods and Supplementary Note). d, Topology of untreated (blue, n = 45) and RA-treated organoids (orange, n = 27) at day 4 are characterized by the number of epithelial lobules N and total genus g, and displayed with respect to the organoid volume. Organoids of different sizes were generated by varying the number of cells to be seeded at day 0 from 300 to 2,400 cells. The dashed lines are linear fits with zero intercept. e, Shape of untreated and RA-treated organoids are represented in the shape diagram, based on the average reduced volume 〈v〉 and average reduced curvature 〈m〉. The parametric curves for the wiffle ball (four passages, d/R = 0.15; dashed line) and spherocylinders (solid line) serve as guides. The morphology of the representative organoids (black circles) from both conditions are displayed. Extended Data Fig. 1e shows the shapes of individual lobules in these organoids. Scale bars, 100 μm.

