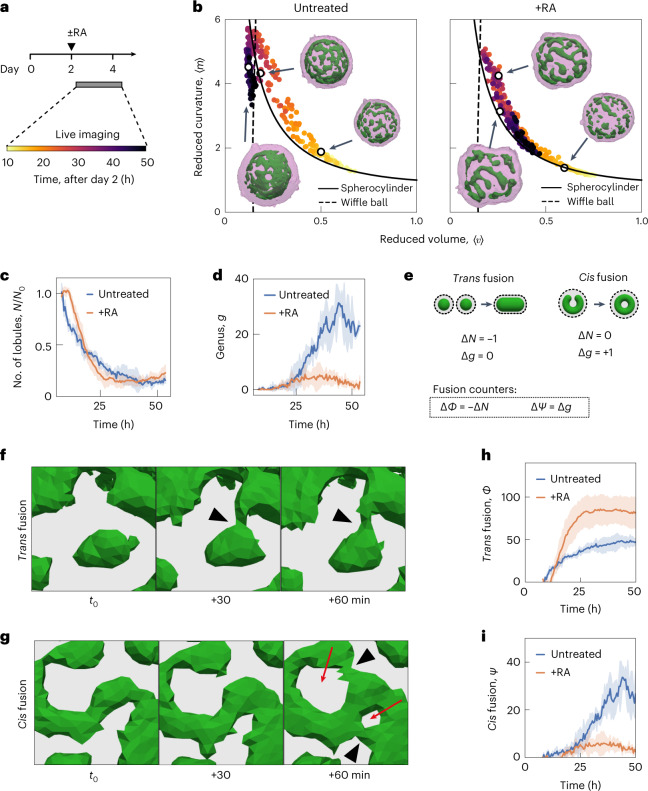
Fig. 2. Trans and cis modes of epithelial fusion underlie the emergence of organoid topology and shape.
a, Experimental timeline for the live imaging experiment to observe organoid morphogenesis. For each time point, 3D images of SiR-actin were used to segment and reconstruct the surfaces that represent the tissue outer boundary (magenta) and apical membranes (green). b, Organoid shape trajectory from day 2 to 4 for n = 3 untreated organoids (left) and n = 4 RA-treated organoids (right). The parametric curves for the wiffle ball (four passages, d/R = 0.15; dashed line) and spherocylinders (solid line) serve as guides. Time indicates hours after RA treatment on day 2. Extended Data Fig. 3b shows the shape trajectory of the largest lobule in the organoids. c, Temporal change in the number of lobules N normalized to the beginning of the video for each organoid. Extended Data Fig. 3c shows the number of lobules N. d, Temporal change in the total genus g of organoids. Extended Data Fig. 3d shows the temporal change in the genus of the largest lobules. e, Trans fusion and cis fusion are two distinct modes of topological transitions that underlie organoid morphogenesis. We define the counting variables for trans and cis fusion solely based on the changes in topological N and g. The schematic shows the typical geometric changes for epithelial fusion observed in our experiments. f, Example of trans fusion in which two separate epithelial lobules fuse their apical surfaces (green). g, Example of cis fusion in which a single epithelial lobule (apical surface, green) fuses with itself. The grey regions indicate the volume occupied by the cells. The arrowheads indicate the location of fusion. The red arrows indicate newly formed passages. h, Cumulative number of trans fusion events Φ over time. i, Cumulative number of cis fusion events Ψ over time. For c, d, h and i, the error bars indicate the standard deviation of n = 3 untreated and n = 4 RA-treated organoids.

