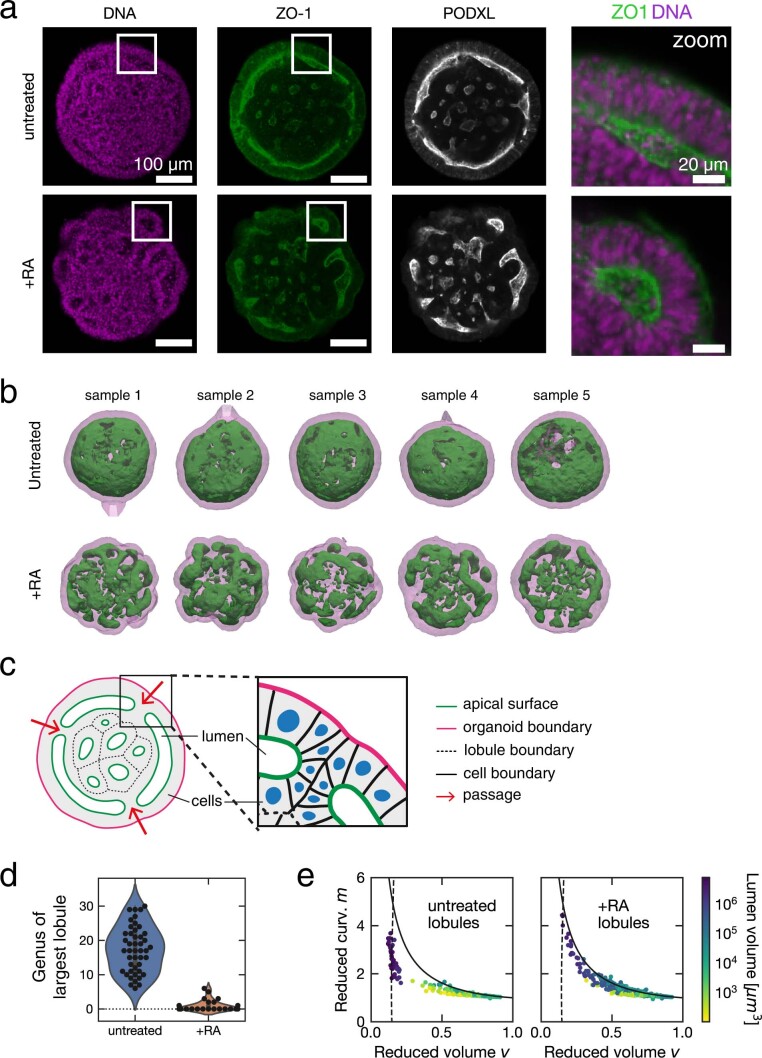
Extended Data Fig. 1. 3D imaging and analysis of optically cleared organoids samples.
a, Single planes from spinning disc confocal microscopy images of optically cleared organoids stained for DNA, anti-ZO1, and anti-PODXL. b, Examples of untreated and RA-treated organoids at Day 4. Surface representations show organoid outer boundary (magenta, transparent) and apical surfaces (green). c, Schematic representation of an organoid cross section, describing the relation between the organoid outer boundary (magenta), apical surfaces (green), lobule boundary (dotted lines), cell nuclei (blue), and passages (red arrow). d, Genus of the largest lobule in each organoid. e, Shape diagram of individual lobules found in multiple organoids. Lumen volume is indicated by colour. Solid line: spherocylinders. Dashed line: wiffle ball. Panels b through c show data from the same n=45 untreated and n=27 RA-treated organoids as in Fig. 1.

