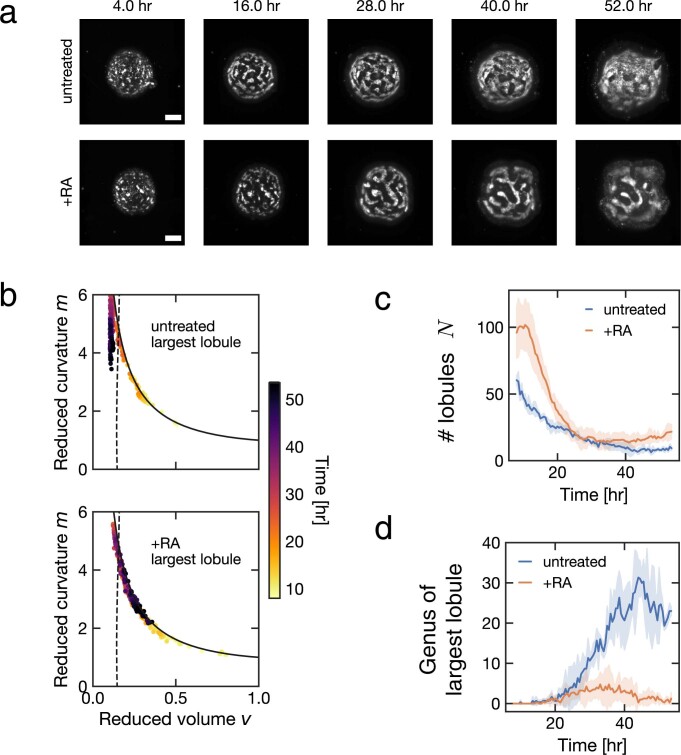
Extended Data Fig. 3. 4D imaging of organoid morphogenesis.
a, Individual frames from light sheet imaging experiment of organoids. Images shown are maximum intensity projections of SiR-actin signal. Time indicates time post RA treatment. b, Shape diagram displays how the shape of the largest lumen in the organoid evolves over time. Solid line: spherocylinder. Dashed line: wiffle ball. c, The temporal change in the number of lobules N in organoids. d, The temporal change in the genus g of the largest lobule of each organoid. Panels show data from the same n=3 untreated and n=4 RA-treated organoids as in Fig. 2. Scale bar, 100 μm.

