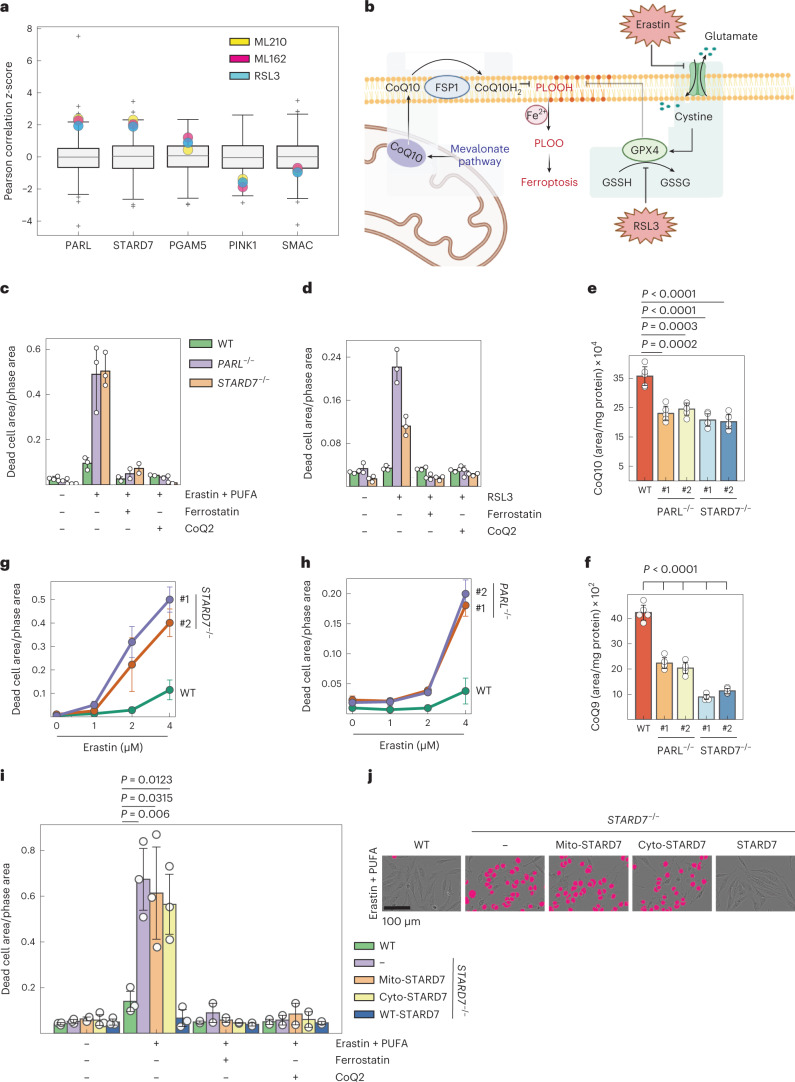
Fig. 2. PARL and STARD7 preserve cells against ferroptosis.
a, Correlation of high expression of PARL and STARD7 with the resistance of cancer cell lines to the GPX4 inhibitors ML210, ML162 and RSL3. Data were mined from CTRP and show z-scores of Pearson’s correlation coefficients. The central band of each box is the 50% quantile, and the box defines the 25% (lower) and 75% (higher) quantile. The whiskers represent the minimum and maximum value in the data, and outliers are indicated by a plus sign (greater distance than 1.8 times interquantile range away from the median). b, Scheme illustrating FSP1-CoQ- and GPX4-dependent oxidative defence pathways as two independent mechanisms protecting against lipid peroxidation and ferroptosis (image created with BioRender.com). c,d, Ferroptosis was induced in WT, PARL−/− and STARD7−/− HeLa cells with either erastin (3 µM) + PUFA (arachidonic acid 20:4, 40 µM) (n = 3 biologically independent experiments) (c) or RSL3 (200 nM) (d) in the presence of ferrostatin-1 (Fer1, 1 µM) and CoQ2 (1 µM) as indicated, and cell death was monitored after 24 h (n = 2). e,f, Total CoQ10/9 levels in WT, PARL−/− and STARD7−/− HCT116 cells. #1 and #2 represent two different clones of indicated genotype. g,h, Increased ferroptotic vulnerability of two different clones of PARL−/− and STARD7−/− HCT116 cells compared with WT upon treatment with indicated concentrations of erastin for 24 h. i, Cell death in WT, STARD7−/− and in STARD7−/− cells expressing mito-STARD7, cyto-STARD7 or STARD7 after 9 h in the presence of the indicated compounds. j, Representative images from i showing dead cells in magenta and living cells with phase contrast after 9 h. In c–i, data were analysed by Instant Clue software and are represented by 95% confidence interval of the mean. n = 3 (d,i), n = 5 (e,f) and n = 4 (g,h) biologically independent experiments. In c–i, the P values were calculated using a two-tailed Student’s t-test for unpaired comparisons. Source numerical data are available in source data.

