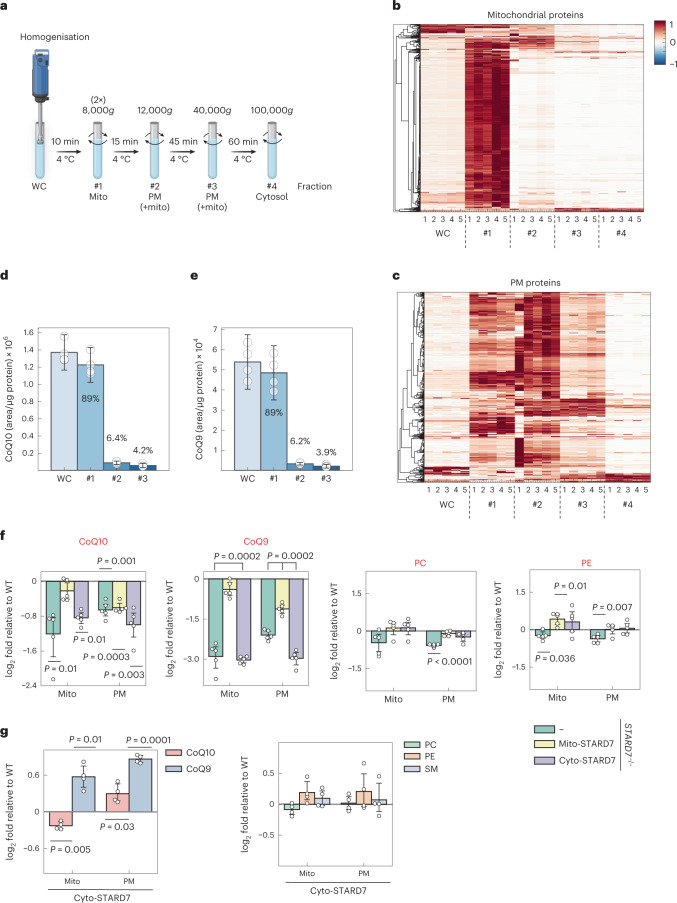
Fig. 4. Cyto-STARD7 is required for CoQ export from the mitochondria.
a, Scheme showing the fractionation protocol for HeLa cells to isolate mitochondria and PM fractions with differential centrifugations (image created with BioRender.com). b,c, Heat maps showing the distribution of mitochondrial (b) and plasma membrane (c) proteins in different fractions of cells determined by MS. #1, 8,000g pellet; #2, 12,000g pellet; #3, 40,000g pellet and #4, 100,000g pellet. n = 5 biologically independent experiments. d,e, Total levels of CoQ10/9 measured in indicated fractions of HeLa cells. CoQ distribution within the cell is indicated in per cent in each fraction. f,g, Differences in the abundance of CoQ10, CoQ9, PC, PE (f,g) and sphingomyelin (SM) (g) in mitochondrial and plasma membrane fractions relative to WT in STARD7−/− cells and STARD7−/− cells complemented with either mito-STARD7 or cyto-STARD7 (f) and in WT cells overexpressing cyto-STARD7 (g). In d–g, data were analysed by Instant Clue software and are represented by 95% confidence interval of the mean. n = 4 (d,e,g) and n = 5 (f) biologically independent experiments. In d–g, the P values were calculated using a two-tailed Student’s t-test for unpaired comparisons (d,e) and two-tailed one-sample t-test for unpaired comparison (f and g). Source numerical data are available in source data.

