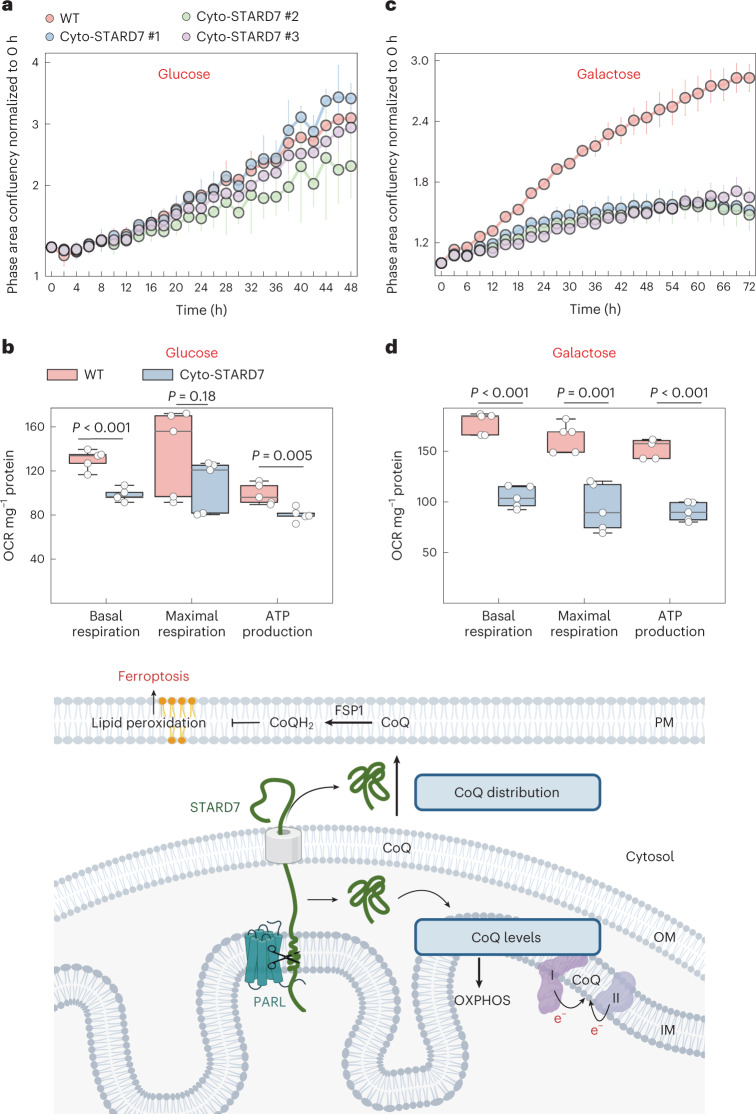
Fig. 6. Overexpression of cyto-STARD7 impairs cell growth and mitochondrial oxygen consumption under respiring conditions.
a–d, Growth rate (a and c) and OCR (b and d) of WT and cyto-STARD7-overexpressing cells in the presence of glucose (25 mM) (a and c) or galactose (10 mM) (b and d). In a–d, data are represented by 95% confidence interval of the mean and the P values were calculated using a two-tailed Student’s t-test for unpaired comparisons where indicated. n = 5 (a, b and d) and n = 4 (c) biologically independent experiments. In b and d, the central band of each box is the 50% quantile, and the box defines the 25% (lower) and 75% (higher) quantile. The whiskers represent the minimum and maximum value in the data. Model illustrating the role of mito-STARD7 and cyto-STARD7 in CoQ biosynthesis and distribution, respectively. OM, mitochondrial outer membrane. Source numerical data are available in source data (image created with BioRender.com).

