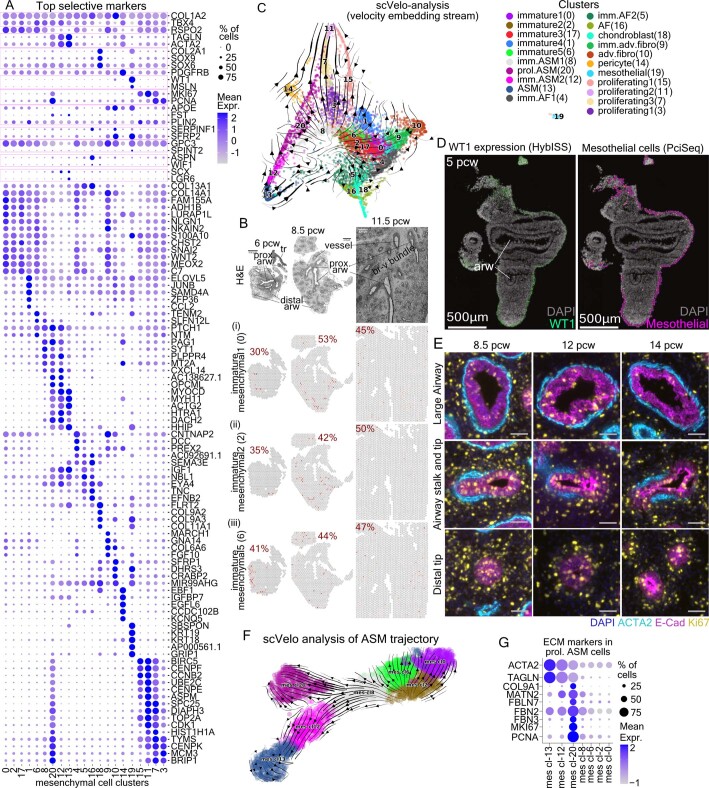
Extended Data Fig. 4. Analysis of mesenchymal cell heterogeneity.
(a) Balloon-plot of known mesenchymal markers (COL1A2-COL14A1), together with the top-5 cluster markers of the mesenchymal dataset (17 donors). General: COL1A22, TBX415, immature: RSPO2117, Smooth Muscle (SM): TAGLN, ACTA22, Chondroblast: COL2A1, SOX9, SOX6118,119, Pericyte: PDGFRB105, Mesothelial: WT1120, MSLN121, Proliferating: MKI67114, PCNA122, Lipofibroblast: APOE, FST, PLIN22, Adventitial-fibroblast: SERPINF1, SFRP22, Alveolar-fibroblast: GPC3, SPINT22, Myofibroblast: ASPN, WIF12, Fibromyocyte: SCX, LGR62, COL13A1pos-fibroblast: COL13A131 and COL14A1pos-fibroblast: COL14A131. From the differentially expressed genes (adjusted p-value < 0.001, MAST, Bonferroni corrected), the top-10 (log2 fold-change) were sorted according to proportion of positive cells in the cluster and the top-5 of these were plotted. (b) Stereoscope assigned distribution of (i) mesechymal1 (cl-0), (ii) mesenchymal2 (cl-2) and (iii) mesenchymal5 (cl-6) cells in three timepoints. Red numbers: the highest percent of the indicated cell-state. Dark red: high, gray: zero. H&E staining: tissue structure. Scale-bar: 400 µm. (c) scVelo-analysis, using a dataset subset (441 cells/cluster) from all donors. Arrow direction: future state, arrow size: transition possibility. (d) HybISS analysis of a 5 pcw lung section showing the mesothelial marker WT1 mRNA expression in tissue periphery120,121 (top) and the prediction of mesothelial-cell spatial distribution, according to PciSeq (bottom). Representative data in: https://hdca-sweden.scilifelab.se/tissues-overview/lung/ (e) Immunofluorescence for α-SMA (cyan, SM), Ecad (magenta, epithelium) and MKI67 (yellow, proliferating cells) on 8.5 (left), 12 (middle) and 14 (right) pcw lungs, in proximal-large (top), stalk (middle) and distal (bottom) airways. Nuclei (blue, DAPI). Scale-bars: 50 µm. (f) scVelo-analysis of the proliferation (cl-20) and maturation (cl-12 and −13) airway SM-trajectories. Colors as in ‘B’. (g) Balloon-plot of ACTA2 and TAGLN (SM), COL9A1, MATN2, FBLN7, FBN2 and FBN3 (extracellular matrix) and MKI67 and PCNA (proliferation). In Balloon-plots, size: percent of positives. Color intensity: scaled expression. Blue: high, Gray: low. ‘arw’: airway, ‘prox.’: proximal, ‘tr’: trachea, br-v bundle: bronchovascular bundle.

