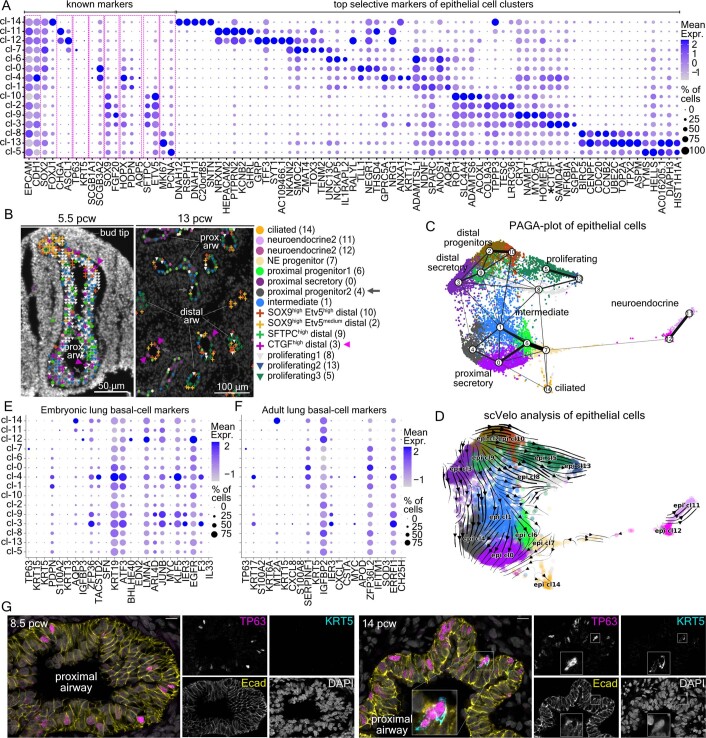
Extended Data Fig. 8. Analysis of epithelial cell heterogeneity.
(a) Balloon-plot of known epithelial markers in the clusters of Fig. 4a, using data from all analyzed donors. General: EPCAM, CDH1, Proximal: SOX26, Ciliated: FOXJ1107, Neuroendocrine: CHGA, ASCL1106, Basal: TP63, KRT5137, Club cells: SCGB1A1, SCGB3A2138, Distal: SOX96, FGF20, Alveolar Type 1 (AT1): HOPX, PDPN, AQP56, AT2: SFPTC, ETV5139 and Proliferating: MKI67114, PCNA120 together with the top-5 identified selective markers (adjusted p-value <0.001, MAST, Bonferroni corrected). The top-10 (log2 fold-change) were selected according to the percentage of positive cells in the cluster. The top-5 were plotted. Gene order follows the cluster order. (b) Annotation of segmented airway areas with PciSeq, using HybISS data in 5.5 pcw (left) and 13 pcw (right) airways. Distal clusters: cross, proliferating: inverted triangle and proximal: circle. Gray arrows: prox. progenitor2 (cl-4), magenta arrowheads: CTGFhigh distal (cl-3). ‘prox.’: proximal, ‘arw’: airway. (c) PAGA-plot of the analyzed epithelial cells, superimposed on the Fig. 4a UMAP-plot. Line thickness: cluster-connection probability. (d) Epithelial-cell scVelo-analysis. Arrow direction: future cell-state, arrow size: transition possibility. (e) Balloon-plot of known embryonic basal-cell markers47. (f) Balloon-plot of the top-20 adult basal-cell markers2, together with TP63 expression in our dataset (blue) shows minimal expression of typical adult basal-cell markers in epithelial cells. (g) Single-plane confocal-microscopy immunofluorescence images for TP63 (magenta), KRT5 (cyan) and E-cadherin (yellow) on 8.5 (top) and 14 (bottom) pcw lung sections. TP63pos cells were mainly localized in proximal airways, with a very small portion being KRT5pos. Nuclear DAPI: gray. Scale-bar: 10 µm. In Balloon-plots, balloon size: percent of positive cells. Color intensity: scaled expression. Blue: high, Gray: low.

