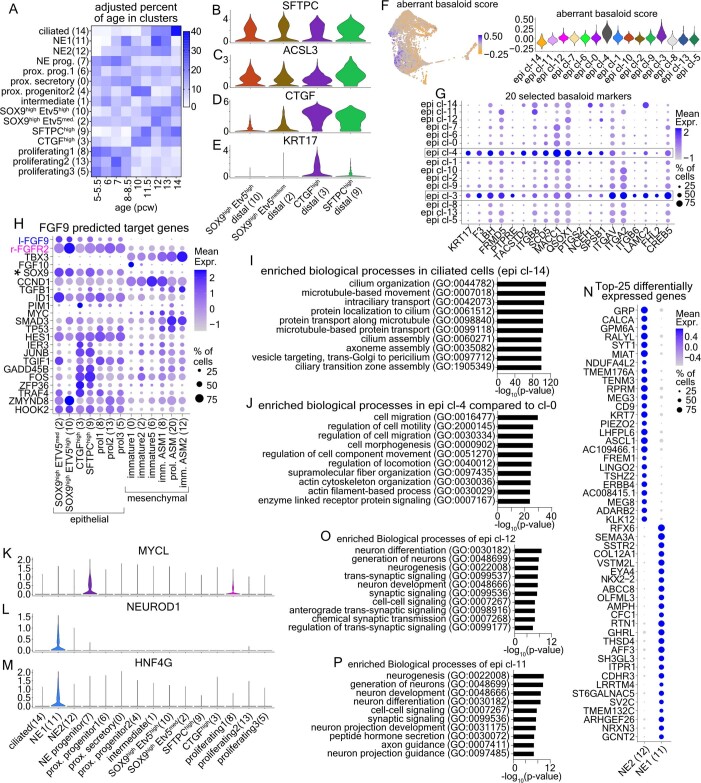
Extended Data Fig. 9. Exploring the diversity within airway neighborhoods.
(a) Heatmap of proportions of donor ages in epithelial clusters. To avoid bias, we normalized according to cell numbers in each stage. Dark blue: high, White: zero. (b–e) Violin plots of SFTPC (B), ACSL3 (C), CTGF (D) and KRT17 (E) expression levels in the distal epithelial clusters. (f) All epithelial-cell UMAP-plot (left) and Violin-plot (right) of the activated-epithelial score, according to the aggregate expression of 96 basaloid4 selective markers (see Supplementary Table 1–8). Blue: high, orange: low. (g) Balloon-plot of epithelial cell-clusters, showing 20 selected basaloid-cell markers. (h) Balloon-plot of the top-20 predicted FGF9-target genes (by NicheNet). (i) p-value bar-plot of the top-10 biological processes in ciliated cells (epi cl-14). (j) As in ‘I’ for the proximal progenitor cells (epi cl-4) compared to the proximal secretory (epi cl-0). (k–m) Violin-plots of the MYCL (K), NEUROD1 (L) and HNF4G (M) in all epithelial clusters. (n) Balloon-plot of NE-cluster markers. The top-50 markers (log2 fold-change, adjusted p-value <0.001, MAST, Bonferroni corrected) were sorted according to the number of positive cells in each cluster and the top-25 were plotted (o) p-value bar-plot of the top-10 biological process in epi cl-11 compared to epi cl-12, using its upregulated genes (adjusted p-value <0.001, calculated by MAST). (p) as in ‘O’ for epi cl-12, compared to epi cl-11. The p-values of enriched biological processes were calculated according to the Hypergeometric Probability Mass Function of https://toppgene.cchmc.org/, using default settings. In Balloon-plots, balloon size: percent of positive cells. Color intensity: scaled expression. Blue: high, Gray: low. In ‘B-D’ and ‘K-M’, expression levels: log2(normalized UMI-counts+1) (library size was normalized to 10.000). All donors were included in the analyses.

