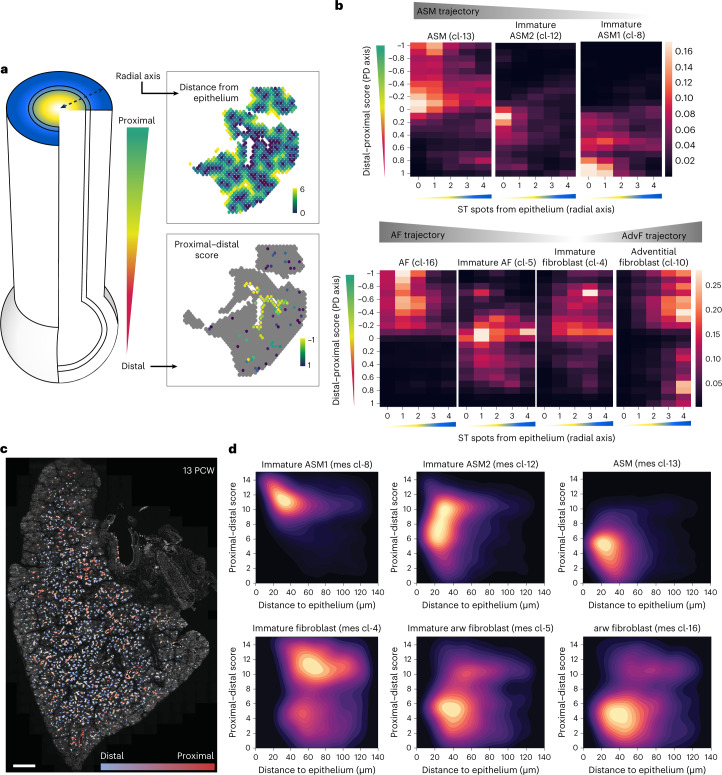
Fig. 6. Assessing the molecular complexity of embryonic human airways.
a, Left: schematic representation of the radial and proximal–distal airway-dependent axes. Right: spatial maps of the radial (top) and proximal–distal (bottom), scores of an 8.5 PCW lung section, analysed by ST. Colour indicates distance from epithelium (number of ST spots). Yellow, high; dark green, zero. Proximal–distal score as scaled aggregated expression of SOX2, SCGB3A2 (proximal) and ETV5, TPPP3 (distal). Proximal, −1; distal, 1. b, Heat maps of ASM-, AF- and AdvF-related cluster-density scores along the two analysed axes. Colour indicates relative cell frequency in the indicated position. Yellow, high; black, zero. c, Proximal–distal axis score of the epithelium of a 13 PCW lung section, analysed by HybISS. DAPI, grey; proximal, red; distal, blue. Scale bar, 1,000 µm. d, Density maps of ASM and AF clusters, showing their distribution along proximal–distal axis (y axis) and their distance from the epithelium (x axis), as in a and b. Colour indicates relative cell frequency in the indicated position. Yellow, high; black, zero.

