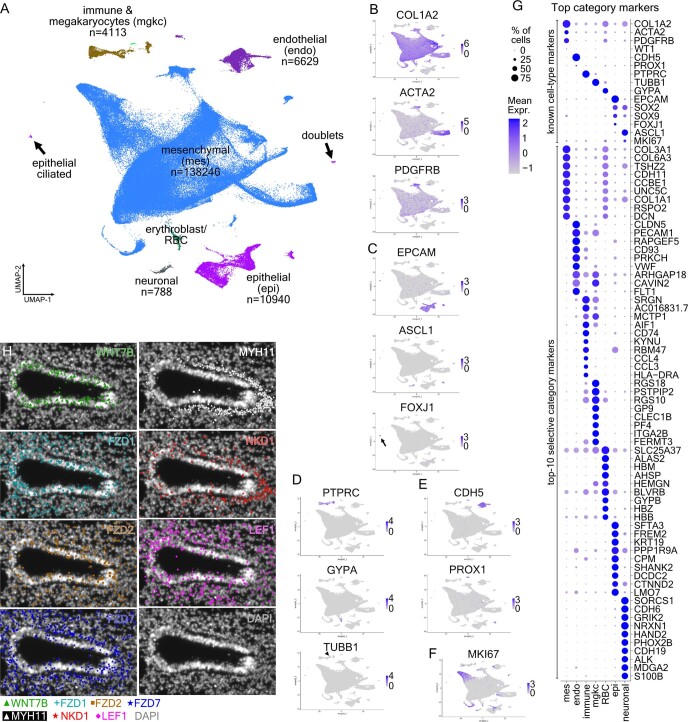
Extended Data Fig. 2. Initial scRNA-Seq analysis suggests six main cell categories, with distinct gene-expression profiles.
(a) Whole-dataset UMAP-plot of the 6 main cell categories, from the 17 donors. ‘n’: number of cells/category. The arrows indicate two clusters of doublets (top) and epithelial ciliated cells (bottom), which have been moved from their original position, in the UMAP-plot and placed in inserts. (b-f) UMAP-plots showing the expression of known markers: mesenchymal (COL1A22, ACTA22, PDGFRB110) (B), epithelial (EPCAM, ASCL1111, FOXJ1112) (C), immune and erythroblasts/erythrocytes (PTPRC113, GYPA, TUBB181) (D), endothelial (CDH582, PROX1114,115) (E) and proliferation (MKI67116) (F). Expression levels: log2(normalized UMI-counts+1) (library size was normalized to 10.000). Blue: high, Gray: zero. (g) Balloon-plot showing the expression of known cell-type markers together with the top-10 most selective category markers (adjusted p-value < 0.001, MAST, Bonferroni corrected using all features)). The top-20 genes (log2 fold-change) were sorted according to positive cells number in the cluster and the top-10 were plotted. Balloon-size: percent of positive cells in cluster. Color intensity: scaled expression. Blue: high, Gray: low. Gene order follows the cell-category order. (h) Single-gene images of the projection in Fig. 1e, showing the mRNAs of WNT7B, FZD1, FZD2, FZD7, LEF1, NKD1 MYH11, detected by HybISS, Interactive inspection of the data is available through the https://hdca-sweden.scilifelab.se/tissues-overview/lung/.

