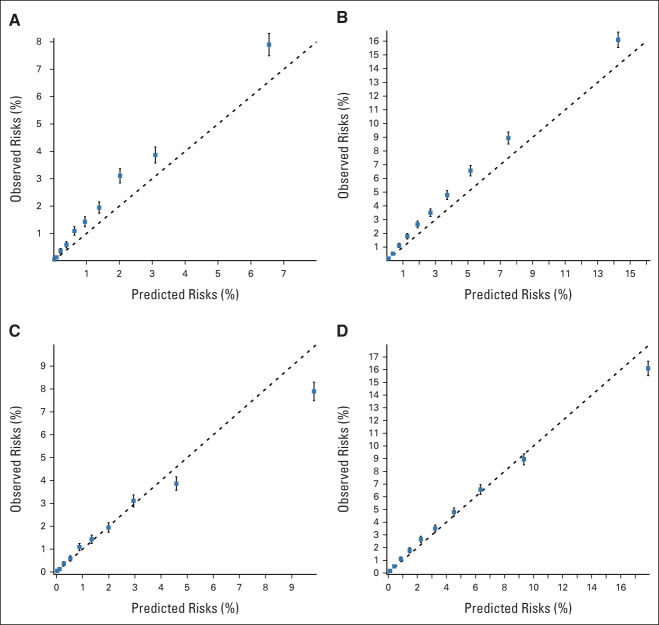
FIG 4.
Calibration plots of the model-predicted and observed prostate cancer risks in the external UK Biobank validation cohort. The graphs show the mean predicted risk under the risk model on the basis of all age, family history, pathogenic variant, and polygenic score information available at baseline, within groups defined by the deciles of the model-predicted risks, against the corresponding observed prospective risks on the basis of the Kaplan-Meier estimator: prostate cancer risk within (A) 5 years; (B) 10 years; (C) 5 years, after recalibrating the risks to account for the excess prostate cancer risk observed in the UK Biobank participants; and (D) 10 years, after recalibrating the risks to account for the excess prostate cancer risk observed in the UK Biobank participants (Data Supplement).

