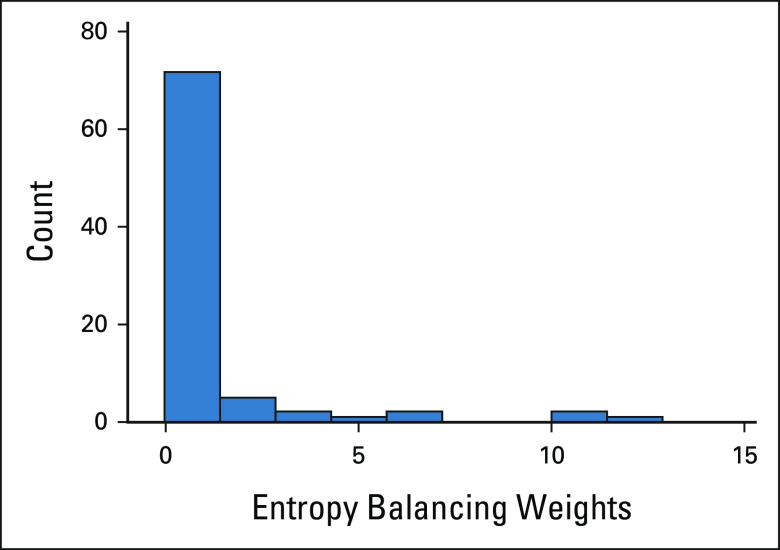
FIG A1.
Histogram of patient weights. Upon diagnosing the weight distribution, most weights were ≤ 1, with some outliers with higher weights. Weight > 1 means that an individual carries more weight in the reweighted population than in the larotrectinib trial population. Weight < 1 means that an individual carries less weight than in the larotrectinib trial population.

