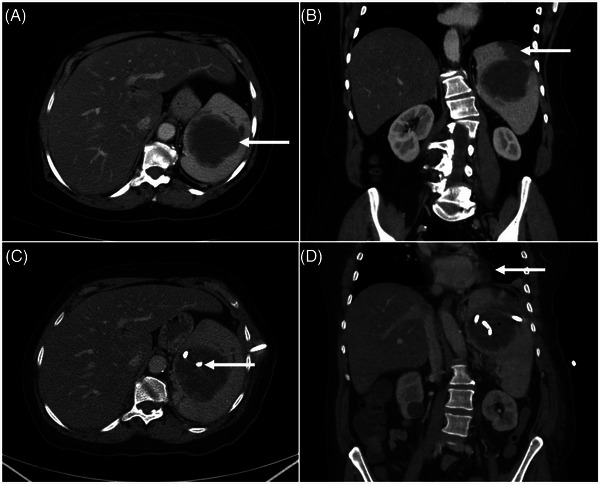
FIGURE 1.

Axial (A) and coronal (B) images from the contrast‐enhanced computed tomography (CT) of the abdomen and pelvis, at the time of the presentation, show a large (∼7 × 7 cm) hypo‐enhancing mass in the spleen (arrow in A) and peripheral wedge‐shaped hypodensity (arrow in B) consistent with an infarct. Follow‐up CT scan (C, D), approximately 3 weeks after placement of the percutaneous drain, shows the pigtail of the catheter inside the lesion (arrow in C) along with a small focus of iatrogenic air (D). No change in the splenic mass and new findings in the left lung base seen as atelectasis and a small pleural effusion (arrow in D)
