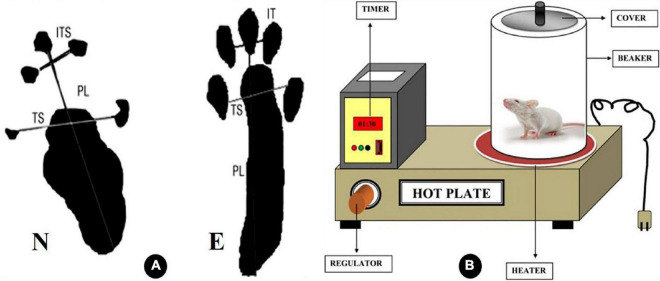
FIGURE 1.
Diagrammatic illustration of the variables considered in calculating the sciatic function index (SFI) in panel (A). IT intermediate toes, PL print length, and TS toes spread, as N is the normal leg and E is the experimental leg A (Barbosa et al., 2010). (B) Explanatory diagram of hot plate analgesiometer (Patel et al., 2016).

