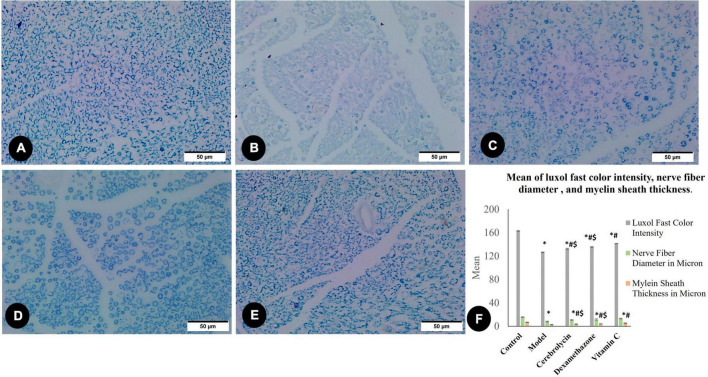
FIGURE 4.
Luxol fast blue staining myelin sheet in the control group (A), the model group (B), the Cerebrolysin group (C), the dexamethasone group (D), and the vitamin C group (E). (F) Histogram illustrates a comparison of the Luxol fast color intensity, myelin sheath thickness in microns, and nerve fiber diameter in microns between different groups. *Significance as compared to control, #significance as compared to the model, and $significance as compared to Vit C group.

