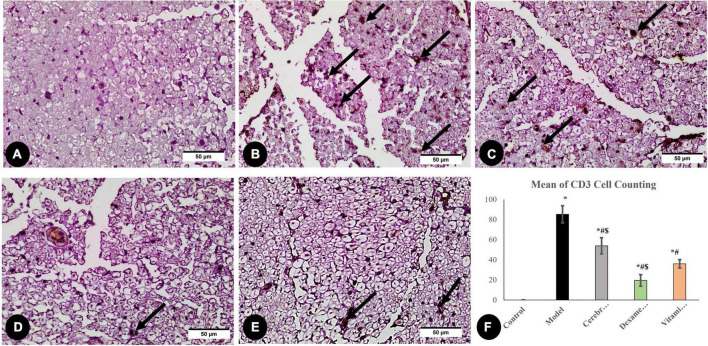
FIGURE 7.
Immunohistochemical analysis of CD3 marker: in the control group (A), the model group (B), the Cerebrolysin group (C), the dexamethasone group (D), and the vitamin C group (E). Arrows point to positively stained cells. (F) Comparison of the expression between different groups. CD3 cell counting was significantly increased in the model group as compared to the control group. The Cerebrolysin group, dexamethasone group, and vitamin C cause a significant decrease in CD3 cell counting correlated with the model group. *Significance as compared to control, #significance as compared to model, and $significance as compared to Vit C group.

