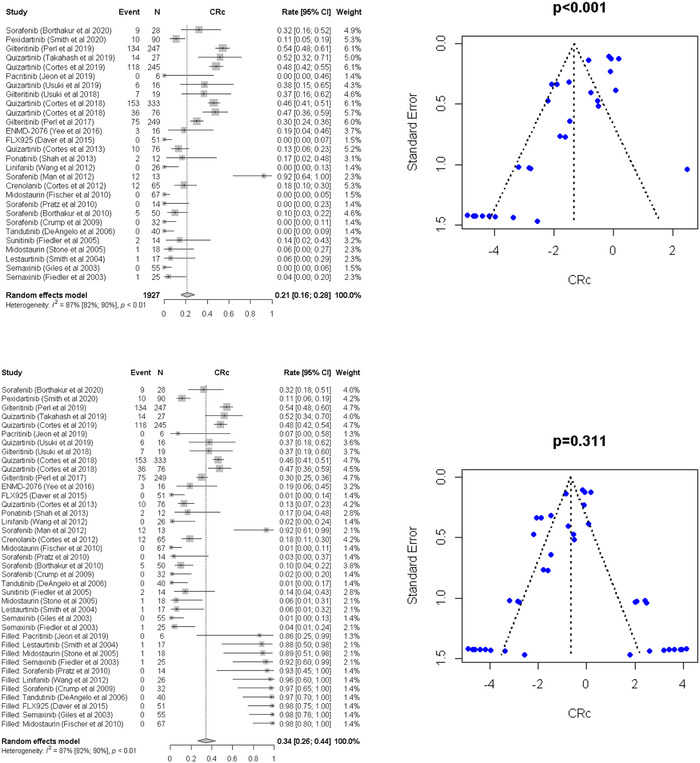
FIGURE 3.

Top: Forest plot of the meta‐analysis and funnel plot for publication bias for overall response rate (ORR) after adjusting publication bias by the trim‐and‐fill method. In the funnel plot, the dotted line represents a triangular 95% confidence region and the pooled estimate based on a random‐effect meta‐analysis. Bottom: Forest plot of the meta‐analysis and funnel plot for publication bias for complete response rate (CRR) after adjusting publication bias by the trim‐and‐fill method. In the funnel plot, the dotted line represents a triangular 95% confidence region and the pooled estimate based on a random‐effect meta‐analysis.
