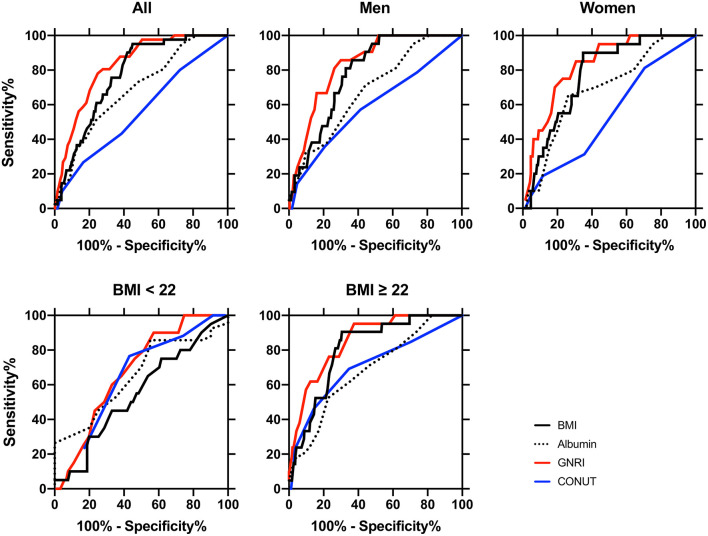
Figure 2.
Receiver-operating characteristic (ROC) curves of the nutritional indexes for distinguishing between sarcopenia (n = 41) and non-sarcopenia (n = 438) patients in all participants (n = 479), in men (n = 264), in women (n = 215), BMI < 22 (n = 111), and BMI ≥ 22 (n = 368) subclasses. The area under the ROC curve (AUC) of body mass index (BMI, black lines), serum albumin (dotted lines), geriatric nutritional risk index (GNRI, red lines), and controlling nutritional status (CONUT, blue lines) were calculated for detecting diagnosis of sarcopenia, and statistical significance between AUC is shown in Table 3. The cut-off values, sensitivity, and specificity of these indices are also shown in Table 3. The definition and diagnosis of sarcopenia were based on the Asian Working Group for Sarcopenia (AWGS): 2019 Consensus Update on Sarcopenia Diagnosis and Treatment (2).

