
Figure 4.
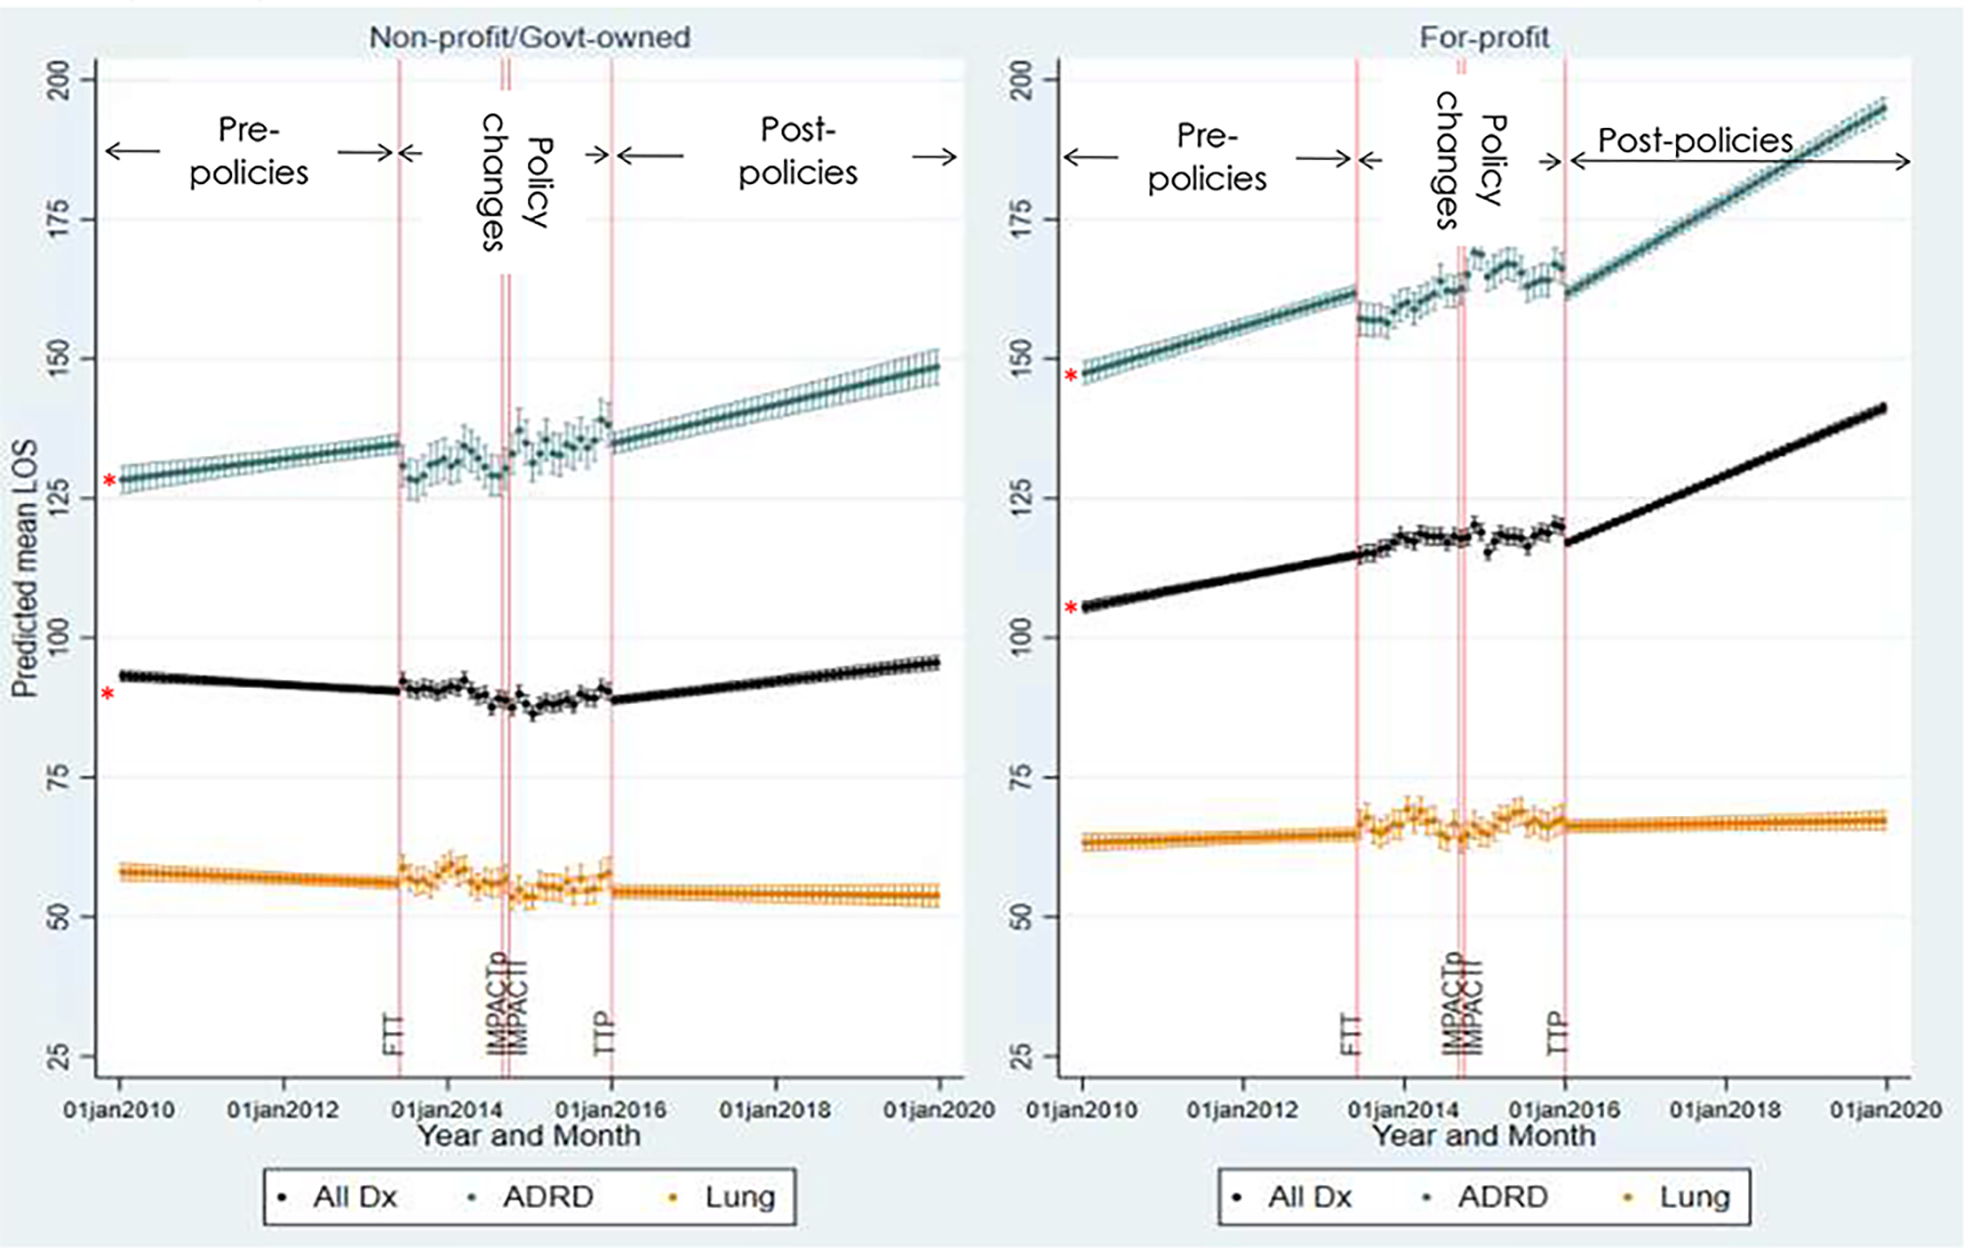
Predicted monthly mean length-of-stay in all patients, patients with ADRD, and patients with lung/trachea cancer,a stratified by hospice ownership, January 2010 – December 2019
Abbreviations: Dx=Diagnoses; FTT=Failure-to-thrive/debility exclusion notice; IMPACTp = IMPACT Act passage; IMPACTi = IMPACT Act implementation; LOS=length-of-stay; TTP=two-tier pay implementation
a Predicted trends in this figure were estimated for the “average” non-profit/govt-owned hospice and “average” for-profit hospice, by fitting fully adjusted models to each hospice-month observation, with time-varying hospice- (H) and county- (C) covariates set to the average sample-specific values; additionally, month fixed effects coefficients were set to 0 in these computations in order to exclude seasonality effects and more clearly show trends over time. Red asterisks indicate statistically significant (p<0.05) differences between pre-policies and post-policies slopes.