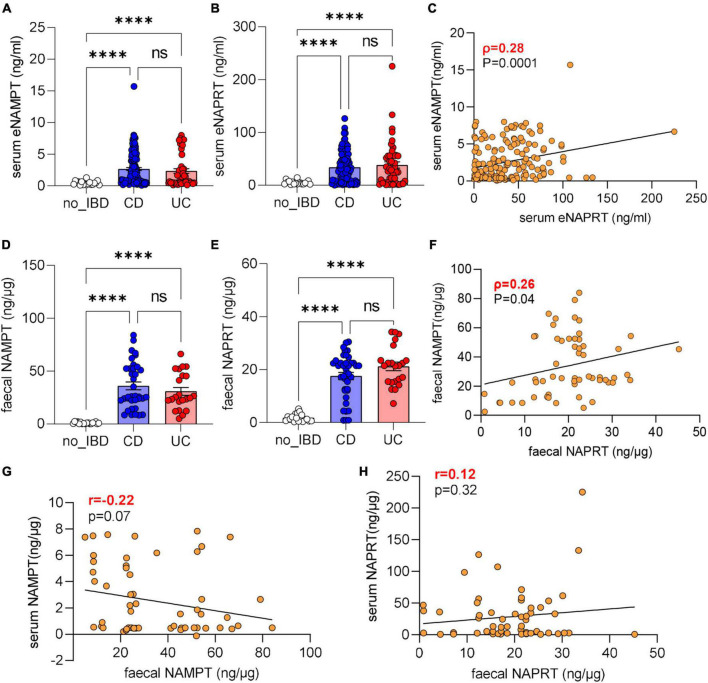
FIGURE 1.
eNAMPT and eNAPRT are increased in serum and faces of IBD patients. (A) Serum eNAMPT levels and (B) eNAPRT levels (healthy controls N = 18: CD n = 128; UC = 52). (C) Pearson correlation between serum eNAMPT and eNAPRT levels in IBD patients. (D) Faucal NAMPT and (E) NAPRT levels (healthy controls N = 18: CD n = 40; UC = 22). (F) Pearson correlation between faucal NAMPT and faucal NAPRT levels in IBD patients. (G) Pearson correlation between faucal NAMPT and serum eNAMPT levels in IBD patients. (H) Pearson correlation between faucal NAPRT and serum eNAPRT levels in IBD patients. P-value: ****p < 0.0001.

