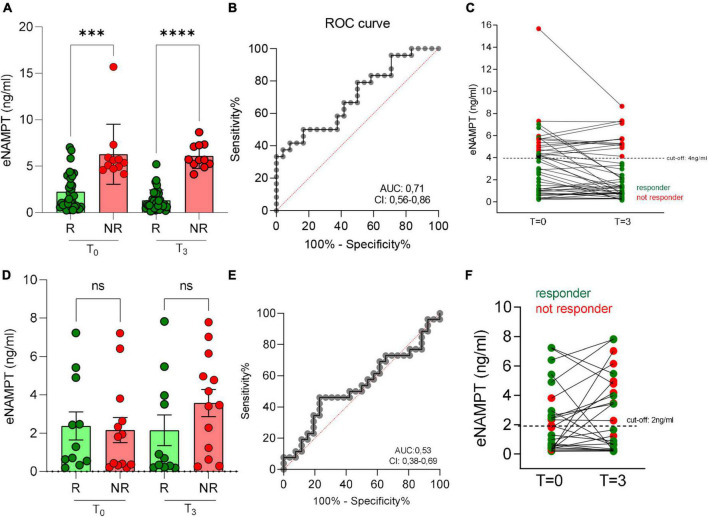
FIGURE 3.
Serum eNAMPT levels and response to anti-TNF treatment in IBD patients. (A) eNAMPT levels in responders (R) and non-responders (NR) to adalimumab at baseline (T = 0) and after 3 months from the first infusion (T = 3). N = 62: CD = 58, UC = 4. (B) ROC curve of adalimumab response. (C) eNAMPT levels in single patients after adalimumab infusion. Red dots represent NR, green dots represent R. N = 62: CD = 58, UC = 4. (D) eNAMPT levels in R and NR to vedolizumab at baseline (T = 0) and after 3 months from the first infusion (T = 3). N = 40: CD = 23, UC = 17. (E) ROC curve of vedolizumab response. (F) eNAMPT levels in single patients after vedolizumab infusion. N = 40: CD = 23, UC = 17. Red dots represent NR, green dots represent R. P-value: ***p < 0.001 and ****p < 0.0001.

