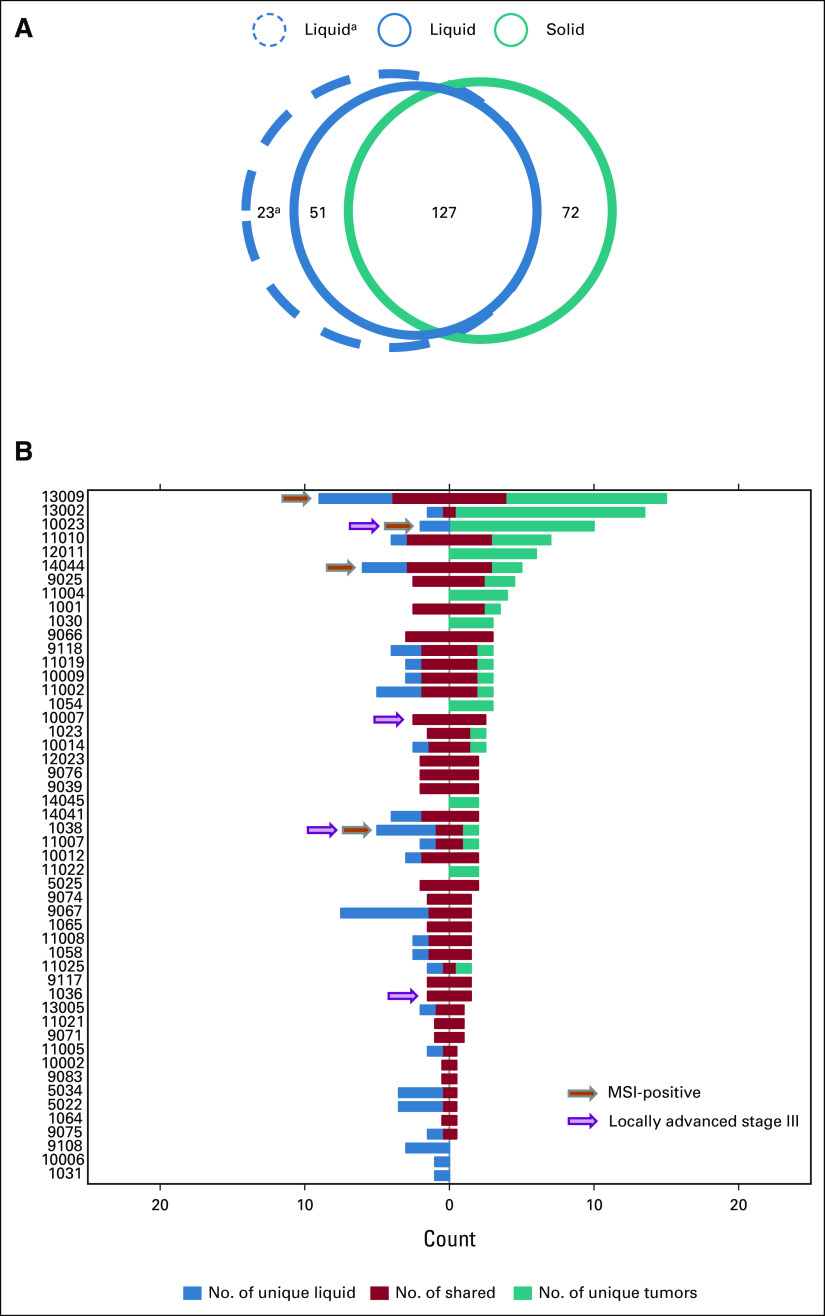
FIG 2.
Concordance between liquid and solid biopsies. (A) Venn diagram illustrating the total numbers of mutations detected in liquid and solid biopsies across all 50 analyzed patients with GEP-NEC. Blue circles indicate numbers of mutations detected in liquid biopsies (solid line, with filtering against WBC data; dotted line, without filtering against WBC data) and the teal circle indicate the numbers of mutations detected in solid biopsies. Numbers indicate data from 76 genes where mutation status was assessed in both liquid and solid biopsies (ie, excluding data for PMS2 from the 77-gene Avenio panel). aWithout filtering of variants seen in WBC. (B) Co-bar plot illustrating the concordance and differences in mutations detected in liquid and solid biopsies from each of the 50 analyzed patients. Each horizontal bar represents one patient (as indicated on the y-axis). The blue part of each bar illustrates the number of mutations (x-axis) uniquely detected in liquid biopsies. The red part indicates shared mutations (detected both in liquid and solid biopsies), while the teal part illustrates mutation uniquely detected in solid biopsies. Data presented represent the findings in liquid biopsies after additional filtering against WBC data (see Methods). Orange arrows indicate MSI-positive cases, while purple arrows indicate cases with locally advanced stage III disease without metastases. GEP-NEC, gastroenteropancreatic neuroendocrine carcinoma; MSI, microsatellite instable.

