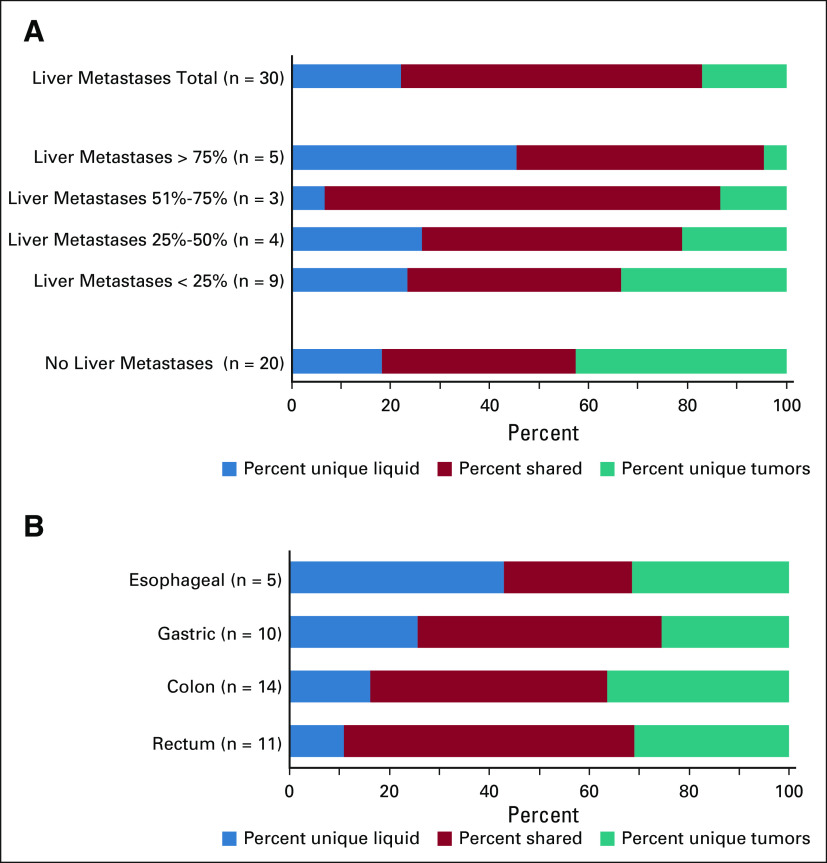
FIG 3.
Concordance between liquid and solid biopsies in subgroups of patients with GEP-NEC. (A) Co-bar plot illustrating the difference in concordance of mutations detected in liquid and solid biopsies between patients with and without liver metastases as well as subgroups with different levels of liver affected by disease. The blue part of each horizontal bar illustrates the fraction of mutations (x-axis) uniquely detected in liquid biopsies. The red part indicates the fraction of shared mutations (detected both in liquid and solid biopsies), while the teal part illustrates the fraction of mutations uniquely detected in solid biopsies. Note that the percentages (x-axis) is given as percentage of all three categories of mutations, while the percentages mentioned in the main text (78% and 48%) relate to fractions of mutations in solid tumor biopsies that was also detected in liquid biopsies, ie, for that particular comparison, the sum of the red and teal categories were set to 100%. Data presented in the co-bars represent fraction of mutations, while n for each category refers to the number of patients. Among 30 patients with liver metastases, data on level of liver involvement were available for 21. (B) Co-bar plot illustrating the difference in concordance of mutations detected in liquid and solid biopsies between patients with GEP-NEC of different primary sites. Color keys are as given for panel A. GEP-NEC, gastroenteropancreatic neuroendocrine carcinoma.

