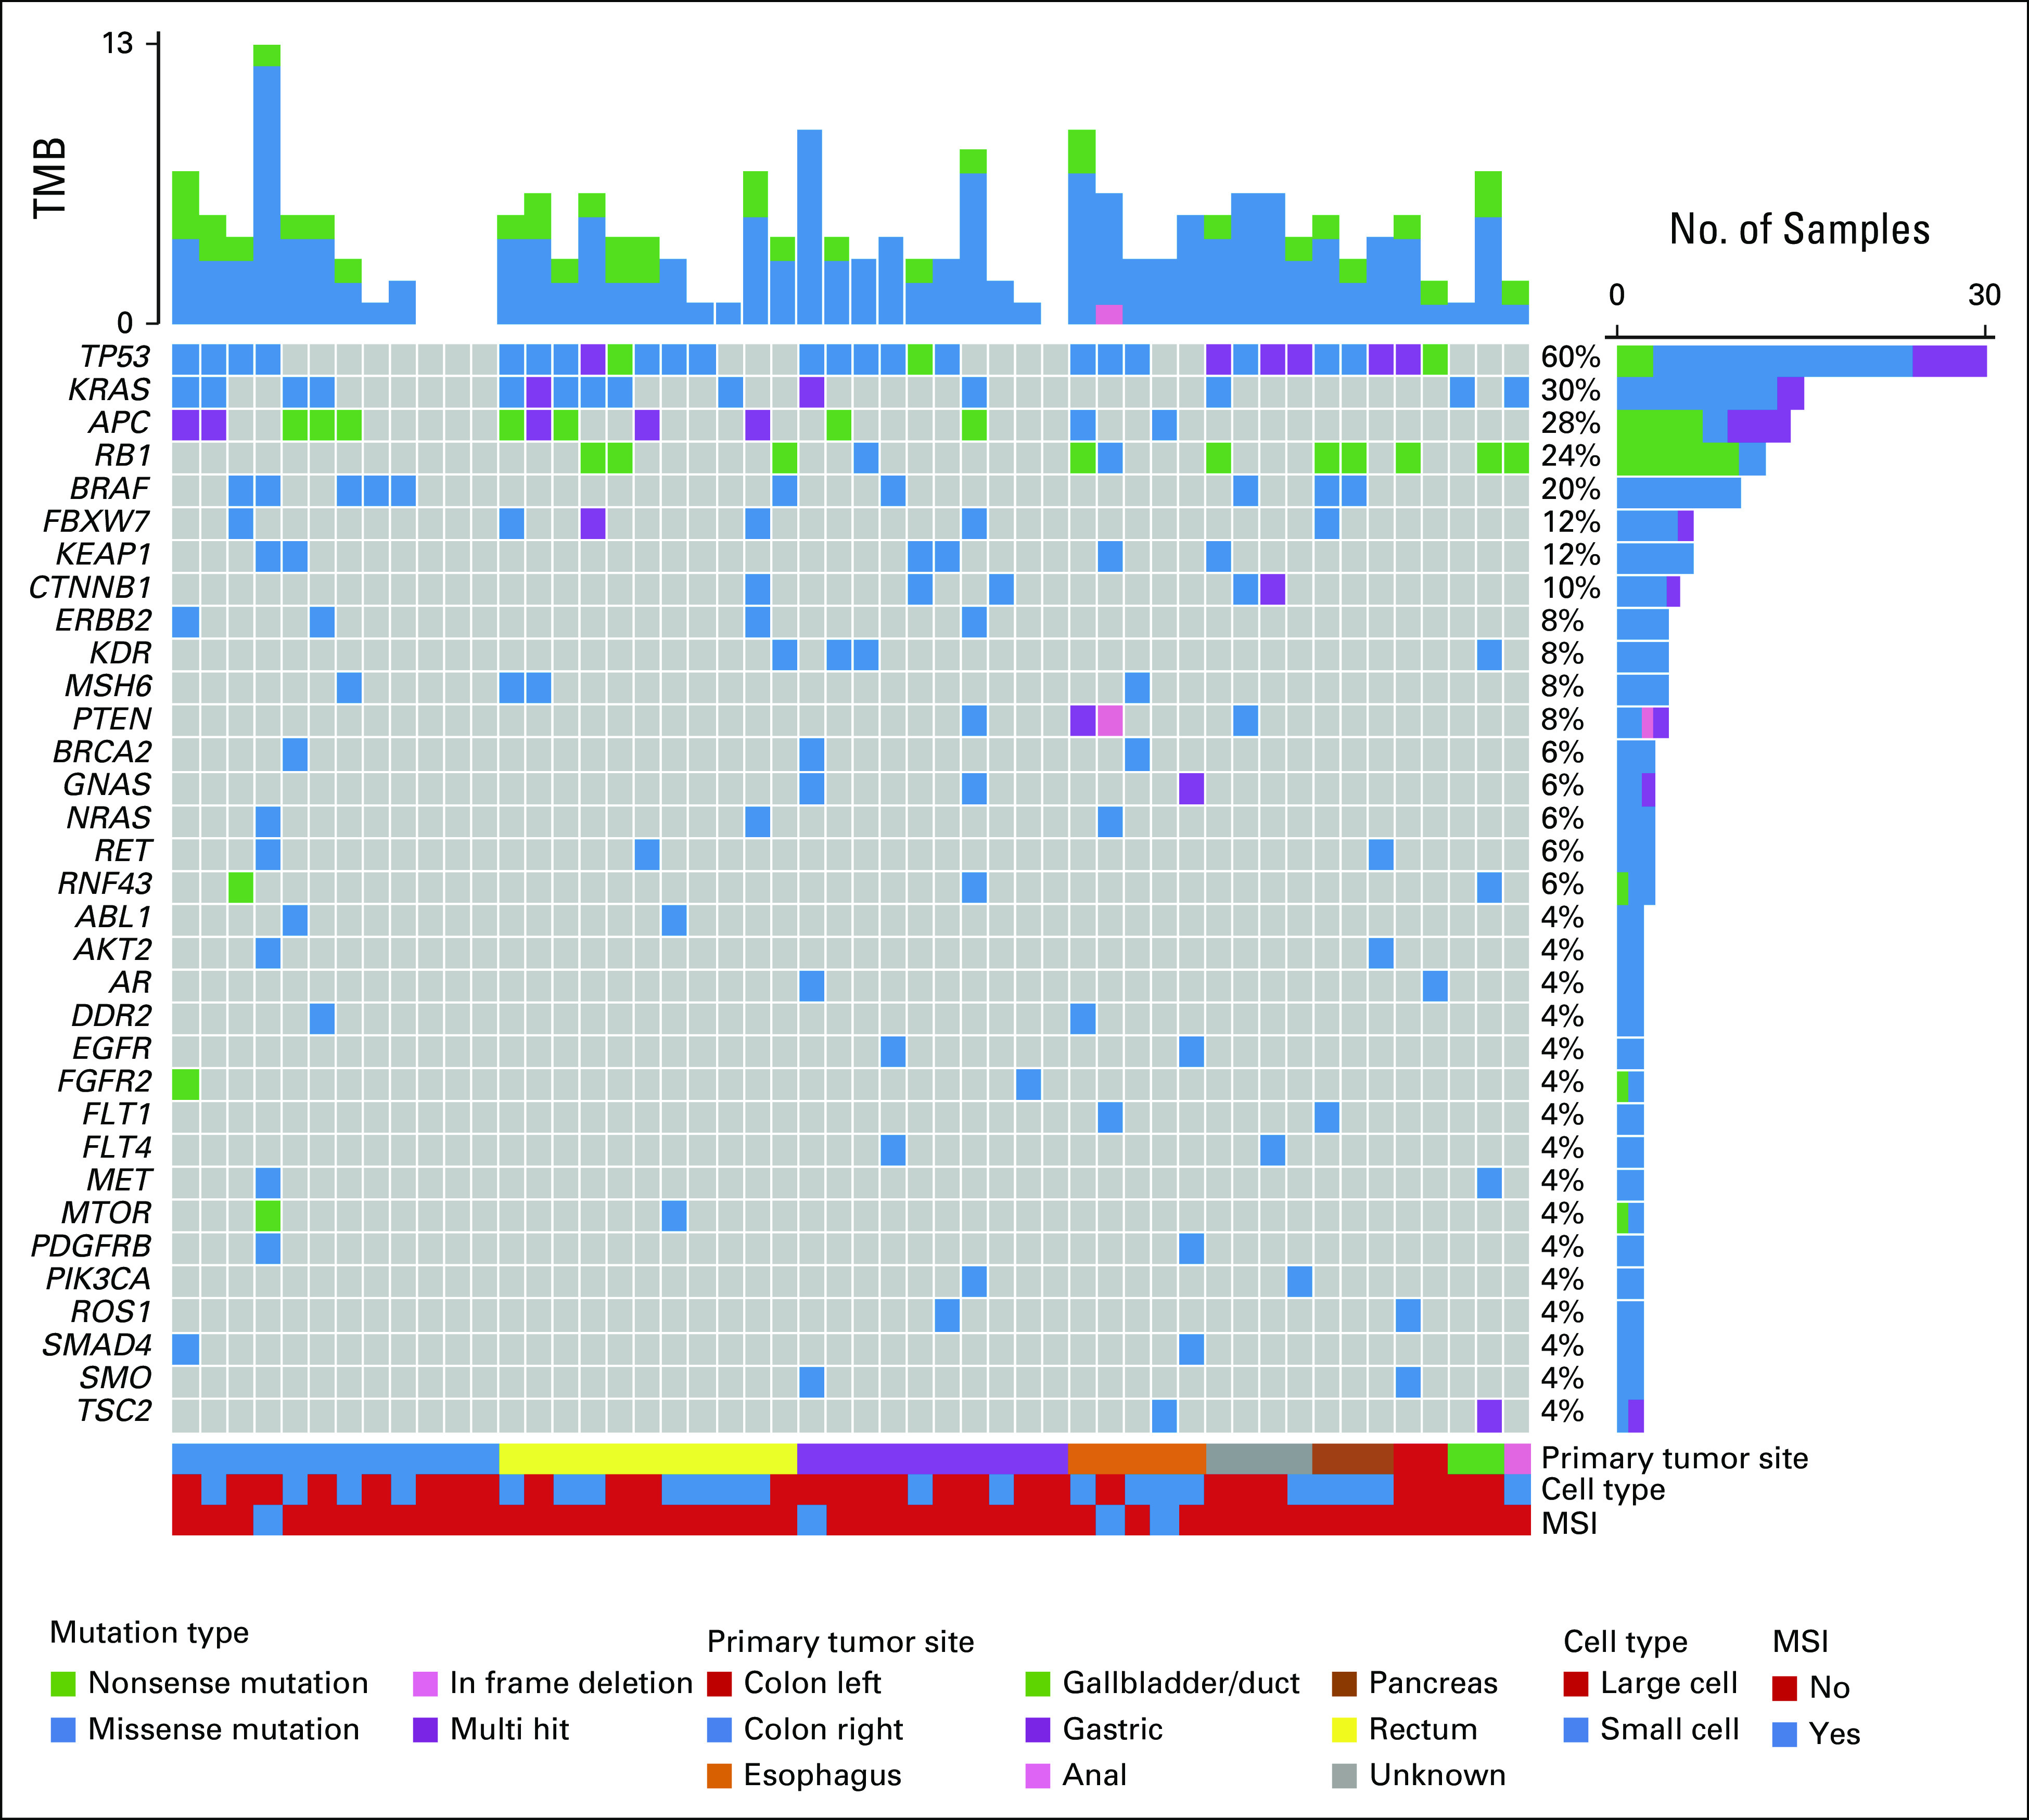
FIG A2.

Mutation spectrum in liquid biopsies from patients with GEP-NEC. The oncoplot shows the most frequently altered genes (rows) in liquid biopsies from 50 patients with GEP-NEC (columns). Upper panel shows the mutational burden per sample. Percentages on the right represent mutations' frequency per gene. The panel under the oncoplot area is composed of three single-row heatmaps showing in order, from top to bottom, primary tumor site, cell type, and MSI status. Multihit indicates that more than one mutation occurs in the same gene, in the same patient. Mutations presented represent the findings in liquid biopsies without filtering against WBC data (see Methods). For data with WBC-based filtering, see main Figure 1. GEP-NEC, gastroenteropancreatic neuroendocrine carcinoma; MSI, microsatellite instable; TMB, tumor mutation burden.
