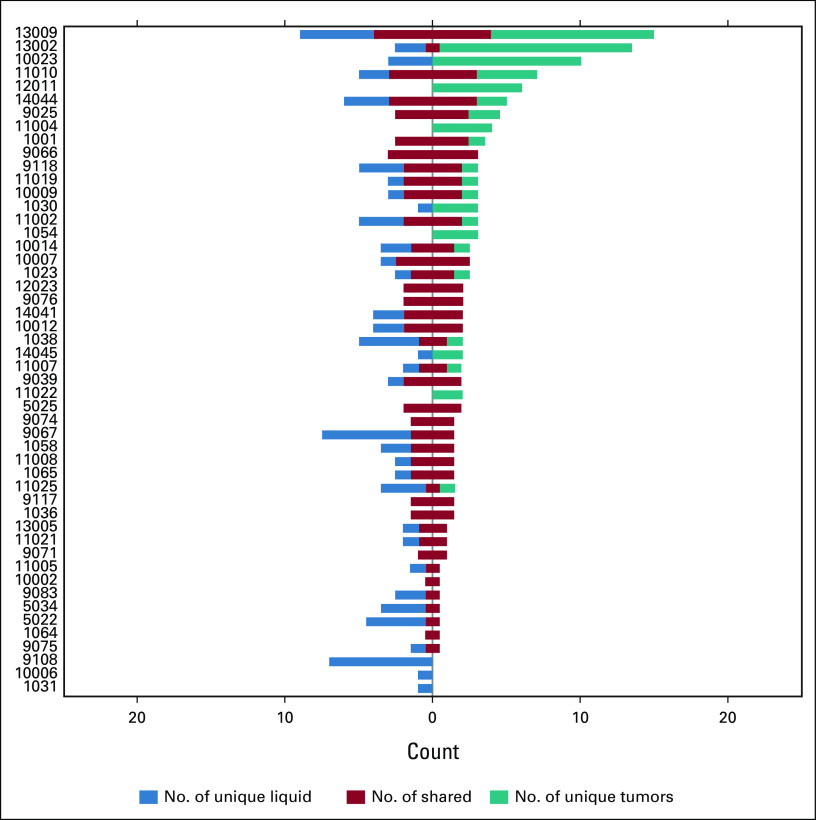
FIG A3.
Concordance between liquid and solid biopsies in individual patients. Co-bar plots illustrating the concordance and differences in mutations detected in liquid and solid biopsies from each of the 50 analyzed patients. Each horizontal bar represents one patient (as indicated on the y-axis). The blue part of each bar illustrates the number of mutations (x-axis) uniquely detected in liquid biopsies. The red part indicates shared mutations (detected both in liquid and solid biopsies), while the teal part illustrates mutation uniquely detected in solid biopsies. Data presented represent the findings in liquid biopsies without filtering against WBC data (see Methods). For data with WBC-based filtering, see main Figure 2.

