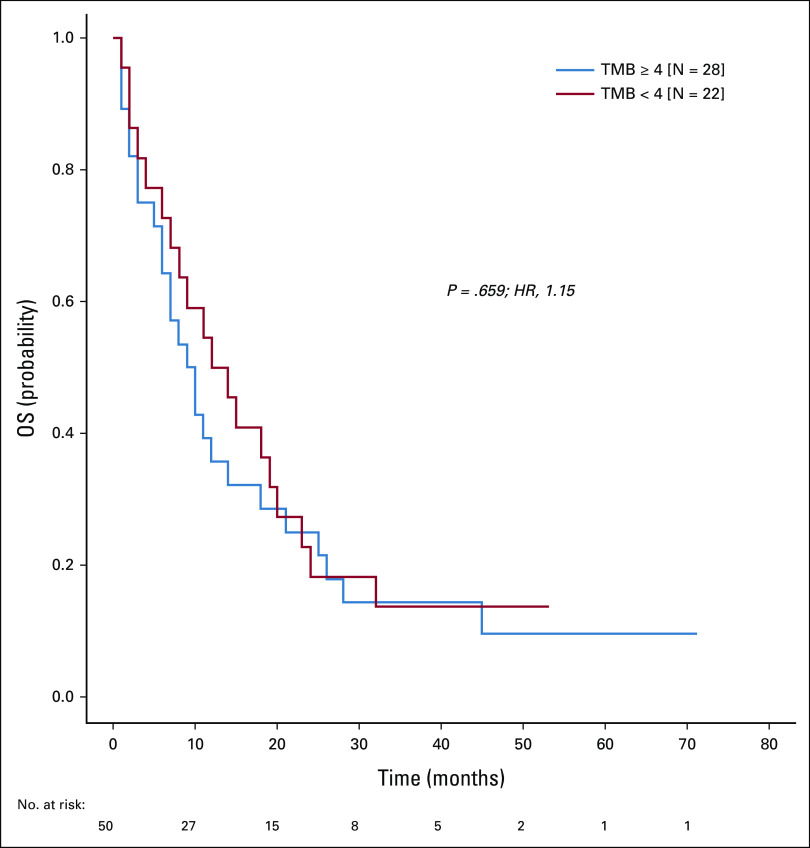
FIG A5.
Overall survival in patients with low versus high mutation burden in liquid biopsies. Kaplan-Meier curves illustrate survival for patients with mutation count in the liquid biopsy below median (four mutations; red line) and above or equal to median (blue line). HR, hazard ratio; TMB, tumor mutation burden.

