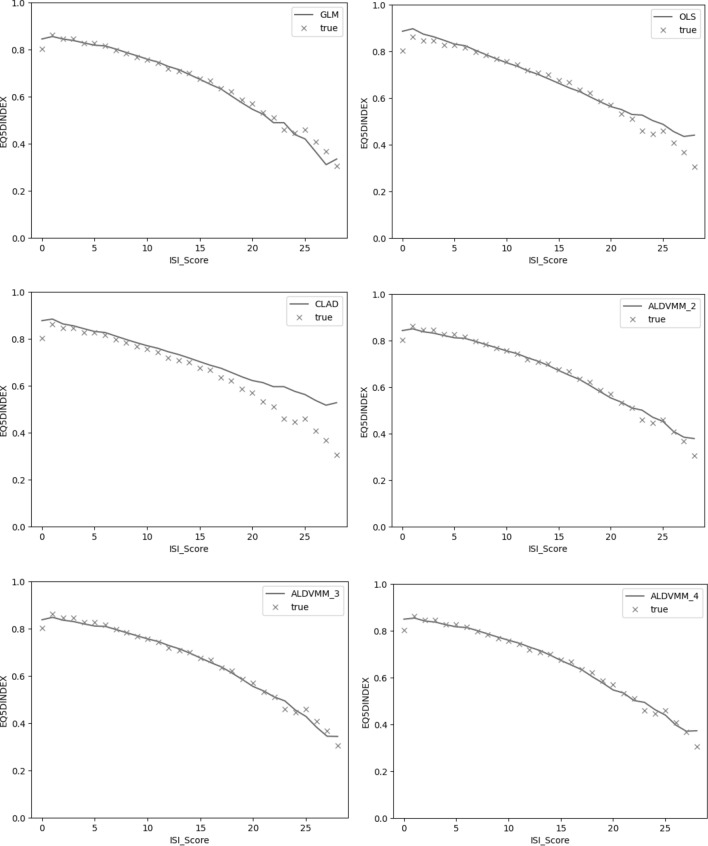
Fig. 2.
Average predictions of the various models on the full dataset (solid line) and observed values (crosses): a GLM gamma-log; b OLS regression; c CLAD; and d–f ALDVMM with two to four components, respectively. Note: the relationship between ISI and EQ-5D in this figure does not control for covariate patterns that vary across the ISI categories. Regarding the apparently low EQ-5D-3L utility corresponding to an ISI score of 0, very few respondents scored a zero on the ISI (n = 81), therefore the low EQ-5D-3L utility may be considered an anomaly due to the low sample size. ALDVMM adjusted limited dependent variable mixture model, CLAD censored least absolute deviation, EQ-5D-3L EuroQol 5 dimensions 3 levels, GLM generalised linear model, ISI insomnia severity index, OLS ordinary least squares

