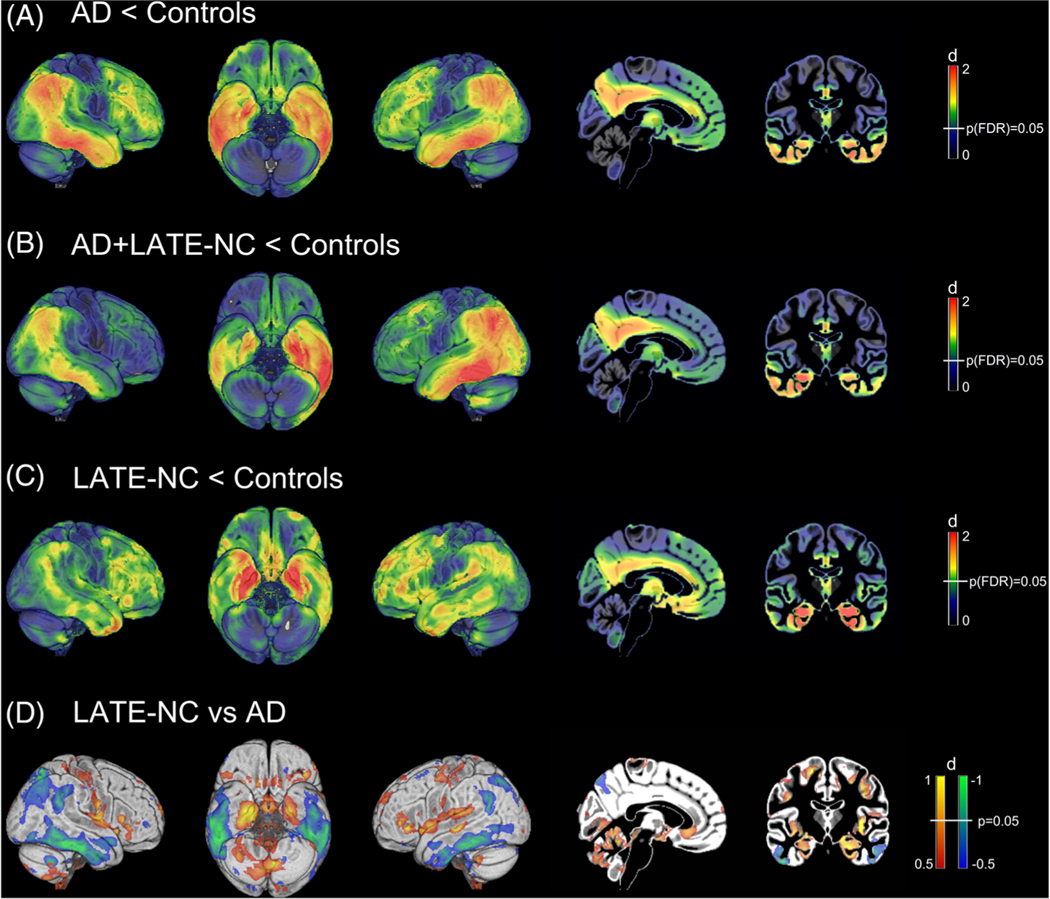
FIGURE 1.
Pathology-specific fluorodeoxyglucose positron emission tomography (FDG-PET) patterns. Illustration of Alzheimer’s disease (AD)–typical and limbic age-related TDP-43 encephalopathy neuropathologic change (LATE-NC)–typical hypometabolic patterns as estimated by voxel-wise comparisons of FDG-PET maps between the pathology-defined AD, AD+LATE-NC, and LATE-NC patient groups and the cognitively normal control group (N = 179). Statistical parametric maps of the respective group differences are expressed as Cohen’s d effect size maps to reveal the brain-wide hypometabolic patterns. White vertical bars in the color scales on the right indicate the color of brain regions that meet the indicated statistical significance threshold. In the direct comparison between the LATE-NC and AD groups no voxels survived false discovery rate correction for the multiple voxel-wise testing. In this comparison, the blue-green color scale indicates more pronounced hypometabolism in AD and the red-yellow color scale indicates more pronounced hypometabolism in LATE-NC

