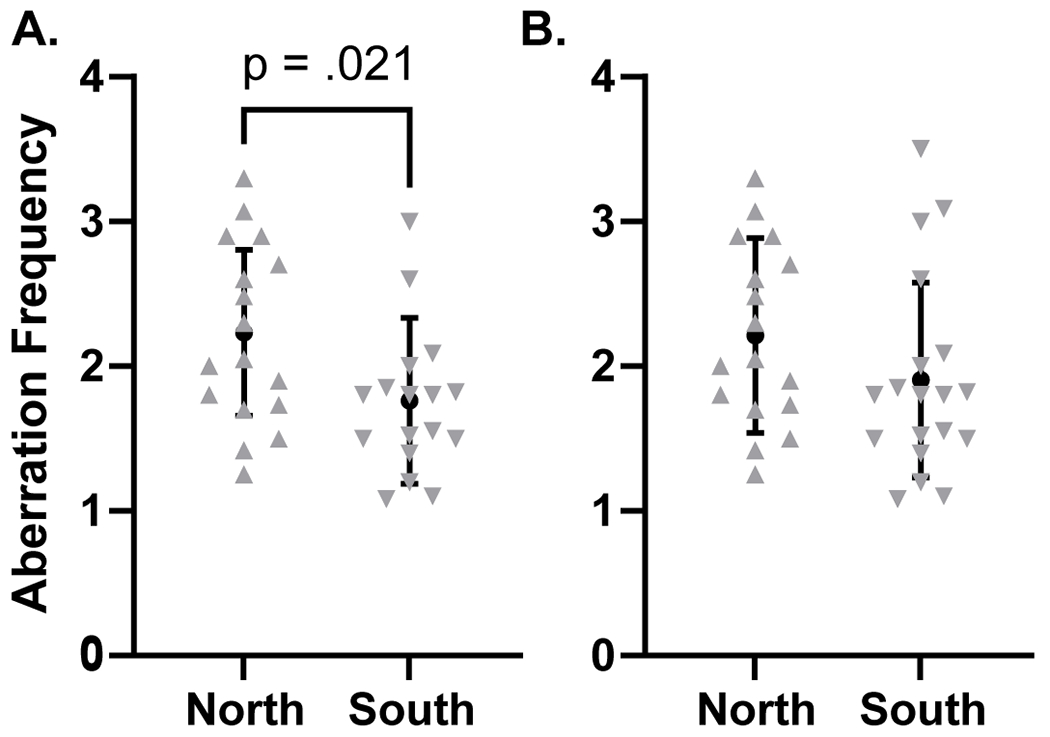
Figure 4.

Analysis of chromosomal aberrations in peripheral lymphocytes of NWA Marshallese (“north” vs “south” scenario). Chromosomal aberration frequency was analyzed with a t-test. A compares aberration frequency between those living on the North Atoll and those living on the South Atoll, while excluding two exceptional individuals (see text for explanation). B shows the same comparison without removing the two individuals from the analysis. Data are represented as mean ± pooled SD.
