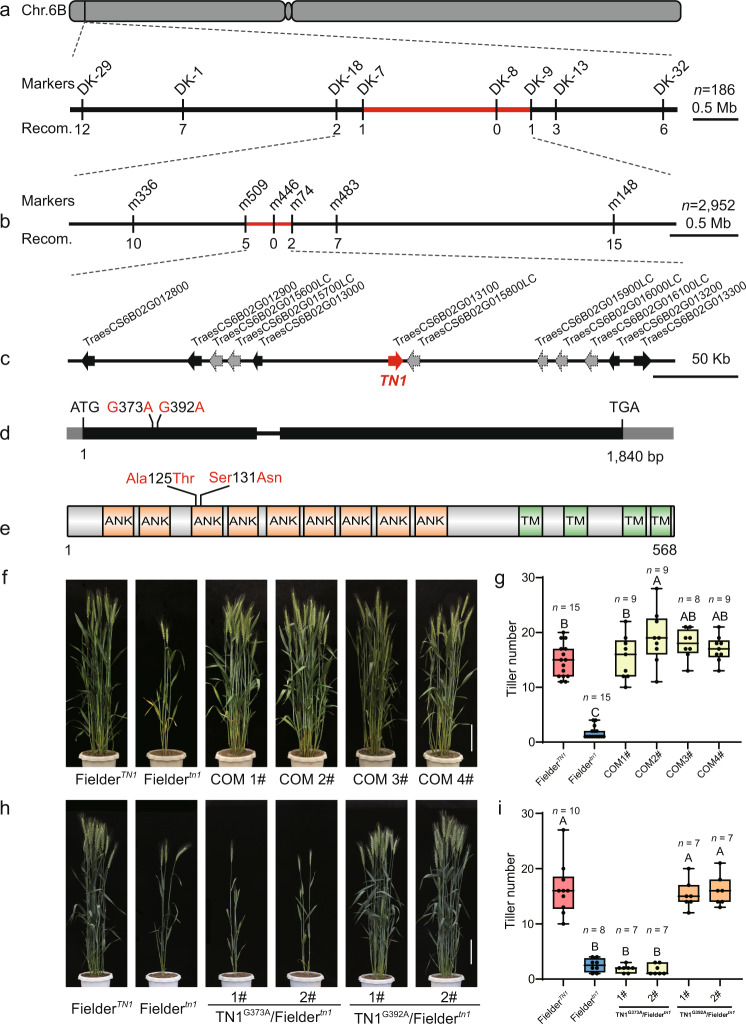
Fig. 2. Map-based cloning of TN1.
a, b Positional cloning of TN1. a Using 186 low-tillering individuals, TN1 was first mapped to an ~2.3-Mb genomic DNA region between KASP markers DK-7 and DK-9, with no recombinants detected between tn1 and the marker DK-8. b By using 2952 recessive individuals, TN1 was fine-mapped to an ~352-kb genomic region flanked with SSR markers m509 and m74, with no recombinants detected between tn1 and marker m446. The numbers below the lines indicate the number of recombinants. c Genes annotated within the candidate region. The black arrows and dashed gray arrows represent the high-confidence (HC) and low-confidence (LC) genes, respectively. The red arrow indicates TN1. d Schematic diagram of the TN1 locus and mutation sites. Black boxes, exons; gray boxes, untranslated regions (UTRs); black horizontal line, intron. The nucleotide changes and positions of mutations are shown as indicated. e Schematic diagram of the predicted TN1 protein. ANK, ankyrin repeat domain; TM, transmembrane helix region. The amino acids changes are shown as indicated. f, g Morphology (f) and tiller number (g) for FielderTN1, Fieldertn1, and positive transgenic lines (COM 1#–4#) from the complementation test. h, i Morphology (h) and tiller number (i) of the transgenic lines with the TN1pro:TN1G373A or TN1pro:TN1G392A construct. Scale bar, 20 cm in f and h. Data in g and i are means ± SEM, and tiller numbers were measured at grain-filling stage from independent transgenic plants. Different letters indicate significant differences between groups, as determined by one way ANOVA with Duncan’s multiple range tests (p < 0.01). The two whiskers of the box plot and the middle, upper, and lower box lines represent the maximum, minimum, median and two quartiles of values in each group. Source data are provided as a Source Data file.

