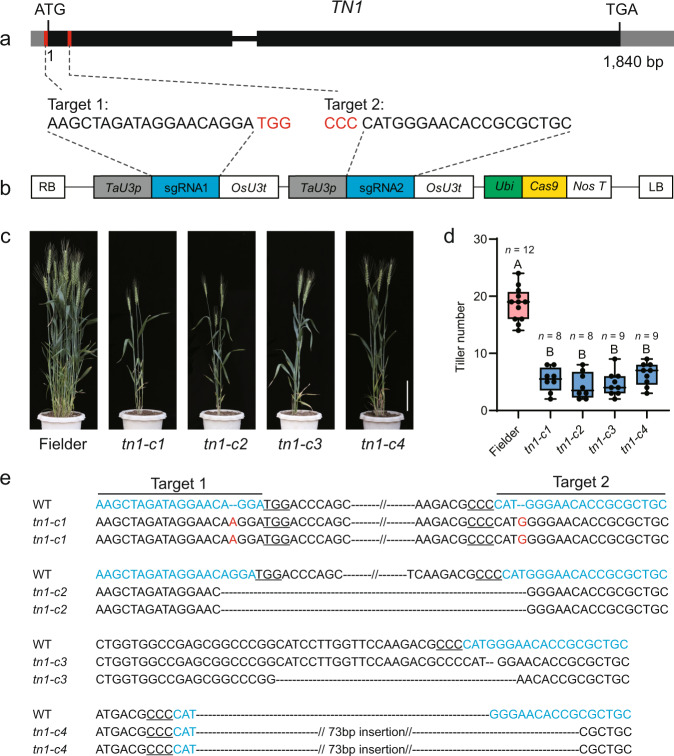
Fig. 3. The tn1 mutants generated by CRISPR/Cas9 exhibit reduced tiller numbers.
a Schematic diagram of TN1 and the target sites for the single guide RNAs. Red boxes in the gene model represent the target sites, and sequences are shown underneath with the protospacer-adjacent motif (PAM) highlighted in red. b Schematic diagram of the gene-editing construct used for transformation. TaU3p, wheat U3 promoter; sgRNA, single guide RNA; OsU3t, rice U3 terminator; Ubi, Zea mays Ubiquitin promoter; NosT, Nos terminator. LB/RB, left/right border. c, d Representative phenotypes (c) and tiller number (d) of the tn1 mutants generated by CRISPR/Cas9-mediated gene editing. Scale bar, 20 cm in c. Data in d are means ± SEM, and tiller numbers were measured at grain-filling stage from independent transgenic plants. Different letters indicate significant differences between groups, as determined by one way ANOVA with Duncan’s multiple range tests (p < 0.01). The two whiskers of the box plot and the middle, upper, and lower box lines represent the maximum, minimum, median and two quartiles of values in each group. e Genotype of the mutant lines. The target sites are marked in blue, and the PAM is underlined. The red letters indicate nucleotide insertions and the black dashed lines represent nucleotide deletions. Source data are provided as a Source Data file.

