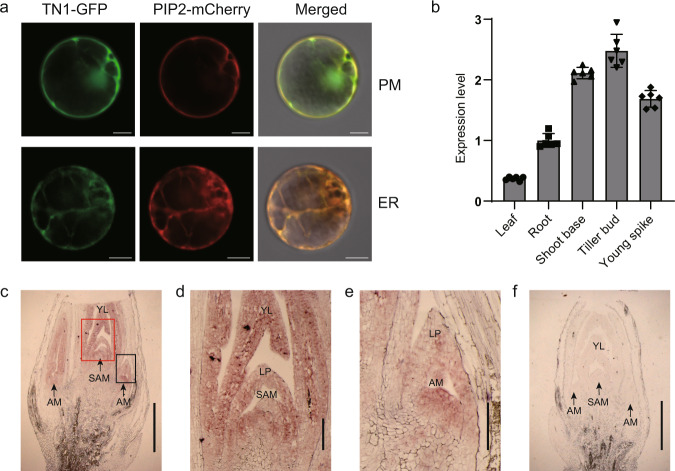
Fig. 4. Subcellular localization and expression pattern analyses.
a Subcellular localization of TN1 and co-localization with PIP2-mCherry in the plasma membrane (PM) pattern and endoplasmic reticulum (ER) network pattern. Images are representative of three independent experiments. Scale bars, 10 μm. b RT-qPCR analysis of relative TN1 expression levels in various tissues of YZ4110. Leaves, roots, shoot bases, and tiller buds were collected at the third-leaf stage, and the young spikes were collected at the booting stage. The relative expression levels were normalized to TaGAPDH. Data are means ± SD of six biological replicates. c–f In situ hybridization analysis of TN1 in shoot bases. Images are representative of two independent experiments. The regions in the red and black boxes in c are enlarged in d and e, respectively. SAM shoot apical meristem, AM axillary meristem, LP leaf primordium, YL young leaf. Sense probe control is shown in f. Scale bars, 1 mm in c and f; 0.2 mm in d and e. Source data are provided as a Source Data file.

