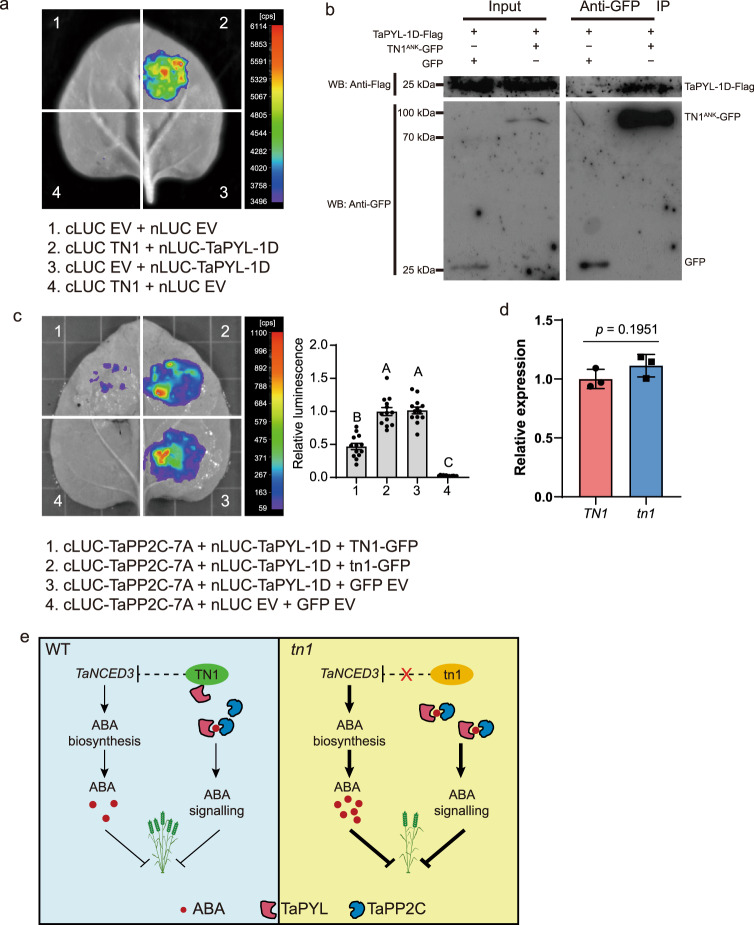
Fig. 6. TN1 interacts with TaPYL to inhibit the physical association between TaPYL and TaPP2C.
a Interaction between TN1 and TaPYL-1D revealed by LCI assay. b The ankyrin repeat domain (TN1ANK, residues 1–422) of TN1 was used to test the interaction by co-immunoprecipitation (Co-IP). After immunoprecipitation with anti-GFP agarose beads, precipitated proteins were probed with anti-Flag (upper panel) and anti-GFP (lower panel) antibody, separately. Images are representative of two independent experiments. c LCI assay showing that the association between TaPP2C-7A and TaPYL-1D was significantly repressed by TN1. Quantification of the relative luminescence intensities were calculated, the values in combination 3 were defined as “1”. Data are means ± SEM (n = 13 biologically independent samples). Different letters indicate significant differences between groups, as determined by one way ANOVA with Duncan’s multiple range tests (p < 0.01). d RT-qPCR assays indicating the relative expression levels of TN1 and tn1 in the infiltrated N. benthamiana leaf areas shown in (c). The data were normalized to NbACT1. Data are means ± SD of three biological replicates, and p values are indicated by two-tailed unpaired t-test. e A proposed working model for TN1 in the regulation of wheat tiller number. Source data are provided as a Source Data file.

