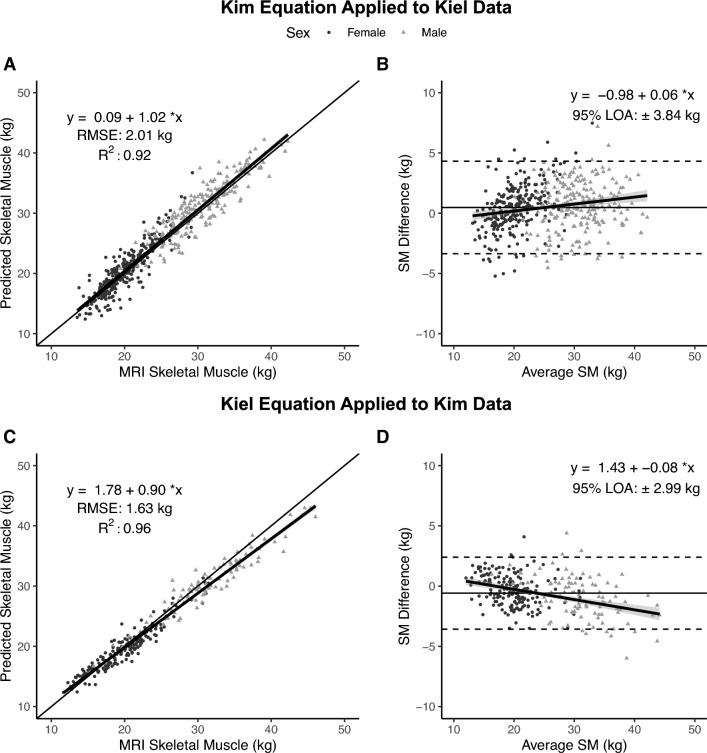
Figure 3.
Total skeletal muscle (SM) mass predicted by Kim’s equation8 versus SM measured with MRI at Kiel (A) and corresponding Bland–Altman plot (B) (n = 475). Total body skeletal muscle (SM) mass predicted by the newly developed Kiel equation versus SM measured with MRI by Kim et al.8 (C) and corresponding Bland–Altman plot (D) (n = 270). The lines of identity (thin solid line), regression equations and lines (solid lines with gray shading indicating 95% CI), and R2s are shown in (A,C). The regression lines with 95% CI and 95% limits of agreement (LOA) (dashed lines) are shown in (B,D). Statistical significance of each panel is summarized in the text.

