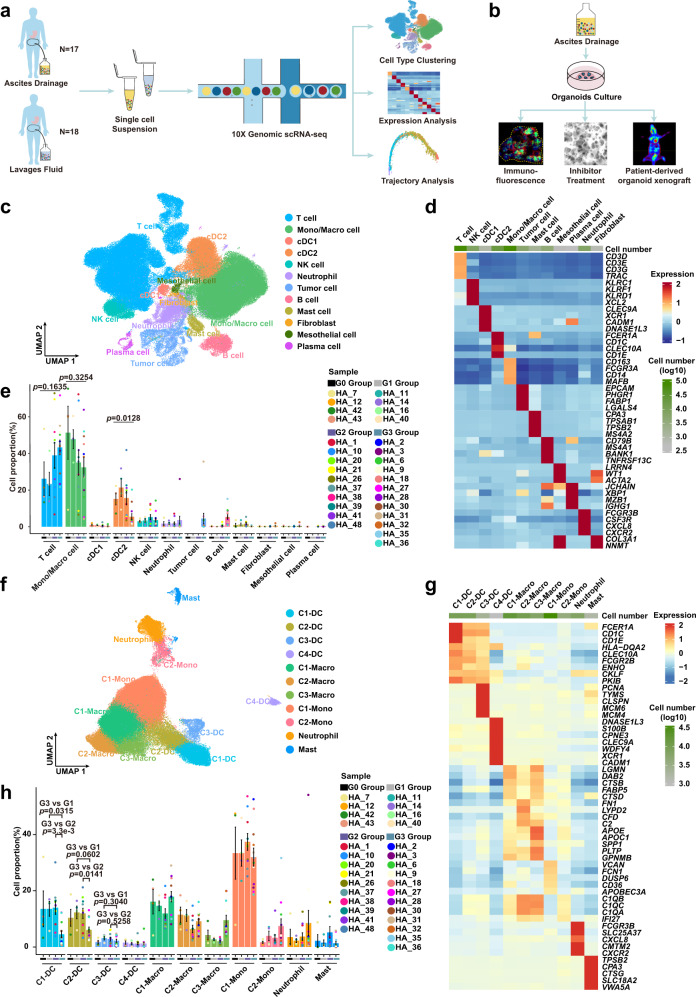
Fig. 1. scRNA-seq profiles of dynamic changes in the peritoneal ecosystem.
a Scheme of the experimental design and analytical workflow of this study for scRNA-seq. b Validation experiment based on patient-derived organoids from ascites. c Uniform Manifold Approximation and Projection (UMAP) plot showing the main cell types from all samples. Each cluster is colored and annotated according to cell type. Mono/Macro, monocyte/macrophage; cDC1, type 1 conventional dendritic cells; cDC2, type 2 conventional dendritic cells. d Heatmap showing z-score normalized mean expression of selected marker genes in each cell type. e The proportion of each cell type in different groups from G0 (n = 4 samples), G1 (n = 4 samples), G2 (n = 10 samples) and G3 (n = 12 samples) Group. Histogram colors correspond to cell type colors in c; point colors correspond to samples. Data are presented as mean values ± SEM (error bars); the p-values are calculated by one-way ANOVA test. f UMAP plot representing myeloid cell clusters colored by cluster. DC dendritic cell, Macro macrophage, Mono monocyte. g Heatmap showing z-score normalized mean expression of selected genes in each cluster of myeloid cells. h The proportion of each cluster of myeloid cells from G0 (n = 4 samples), G1 (n = 4 samples), G2 (n = 10 samples) and G3 (n = 12 samples) Groups. Histogram colors correspond to cell type colors in f; point colors correspond to samples. Data are presented as mean values ± SEM (error bars); the p-values are calculated by two-sided unpaired Student’s t-test. Source data are provided as a Source Data file.

