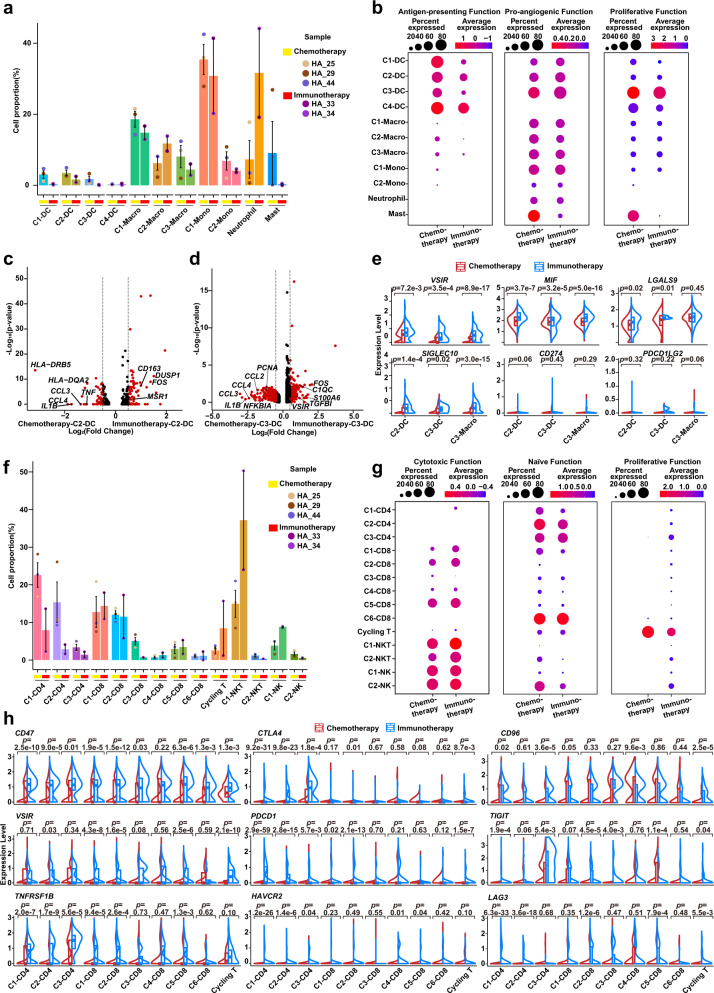
Fig. 5. Immune checkpoint evolution of monocyte-like DC and cycling T cells.
a Cell proportions of myeloid cell clusters after Chemotherapy (n = 3 samples) and Immunotherapy (n = 2 samples) shown in histogram plot. DC, dendritic cell; Macro, macrophage; Mono, monocyte. Histogram colors correspond to cell clusters; point colors correspond to samples. Data are presented as mean values ± SEM (error bars). b Dotplot showing the antigen-presenting, pro-angiogenic, and proliferative function scores of myeloid cell clusters in Chemotherapy (n = 3 samples) and Immunotherapy (n = 2 samples) Groups. Dot size represents percent of expressing cells in each cluster, and color represents mean expression level of selected gene signatures. c, d Volcano plots showing differentially expressed genes (DEGs) of C2-DC (c) and C3-DC (d) between Chemotherapy (three patients) and Immunotherapy (two patients) Groups. e Split violin plots showing expression levels of immune checkpoints of C2/C3-DC and C3-Macro in Chemotherapy (n = 3 samples, red) and Immunotherapy (n = 2 samples, blue) Groups. The comparisons and statistical analyses are conducted between cell clusters (three cell clusters: C2-DC, C3-DC, and C3-Macro) of Chemotherapy and Immunotherapy groups, and the total cells number of all clusters are >3. Box represents median ± interquartile range; p-values are calculated by two-sided unpaired Wilcoxon test. f The same histogram plot as in a for T/NK clusters in Chemotherapy (n = 3 samples) and Immunotherapy (n = 2 samples) Groups. Histogram colors correspond to cell clusters; point colors correspond to samples. Data are presented as mean values ± SEM (error bars). g Dotplot showing the cytotoxic, naïve, and proliferative function scores of T/NK cell types in Chemotherapy (three patients) and Immunotherapy (two patients) Groups. Dot size represents percent of expressing cells in each cluster, and color represents z-score of normalized mean expression level of selected gene signatures. h The same split violin plots as in (e) for T/NK cell types in Chemotherapy (n = 3 samples, red) and Immunotherapy (n = 2 samples, blue) Groups. The comparisons and statistical analyses are conducted between T cell clusters (10 cell clusters: C1-3 CD4, C1-6 CD8, and Cycling T) of Chemotherapy and Immunotherapy groups, and the total cells number of all clusters are >3. Box represents median ± interquartile range; p-values are calculated by two-sided unpaired Wilcoxon test. Source data are provided as a Source Data file.

