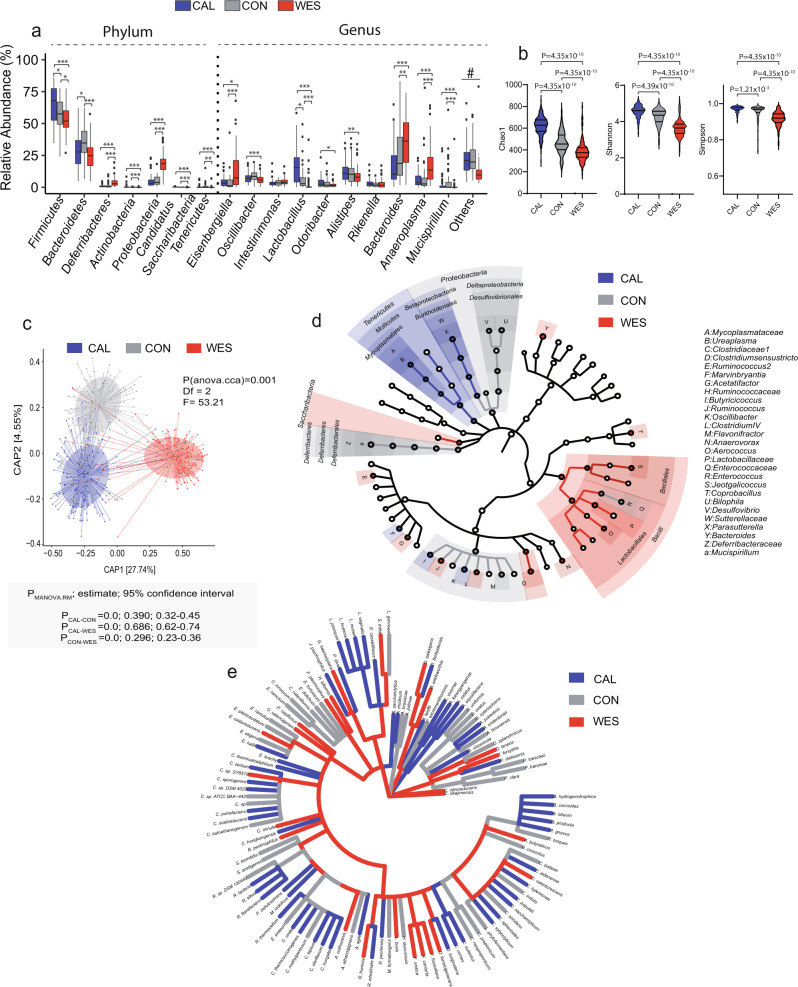
Fig. 2. Diet modulates composition of bacterial standing communities in the host.
a Box plots representing relative abundance of bacterial phyla and genera. The band in the box plot indicates the median, the box indicates the first and third QRs, and the whiskers indicate 1.5*IQR. Calorie-restricted (CAL; blue; nCAL = 239; nmales = 106; nfemales = 133), control (CON; gray; nCON = 136; nmales = 51; nfemales = 85) or WES (Wes; red; nCAL = 182; nmales = 57; nfemales = 125) groups. (Firmicutes: PCAL-CON = 0.01, PCAL-WES = 2.97 × 10⁻⁸, PCON-WES = 0.04; Bacteroidetes: PCAL-CON = 0.01, PCON-WES = 2.92 × 10⁻⁶; Deferribacteres: PCAL-WES = 6.62 × 10⁻¹³, PCON-WES = 9.91 × 10⁻¹⁵; Actinobacteria: PCAL-WES = 5.05 × 10⁻¹⁸, PCON-WES = 8.93 × 10⁻¹²; Proteobacteria: PCAL-WES = 1.43 × 10⁻²⁶, PCON-WES = 1.79 × 10⁻²¹; Candidatus Saccharibacteria: PCAL-WES = 2.51 × 10⁻¹⁹, PCON-WES = 1.77 × 10⁻¹³; Tenericutes: PCAL-WES = 0.0008, PCON-WES = 0.003; Eisenbergiella: PCAL-WES = 0.01, PCON-WES = 6.39 × 10⁻⁶; Oscillibacter: PCON-WES = 0.0005; Lactobacillus: PCAL-CON = 0.01, PCAL-WES = 7.24 × 10⁻²⁶, PCON-WES = 2.15 × 10⁻¹³; Odoribacter: PCAL-WES = 0.01; Alistipes: PCAL-WES = 0.007; Bacteroides: PCAL-WES = 1.39 × 10⁻⁸, PCON-WES = 0.002; Anaeroplasma: PCAL-WES = 9.41 × 10⁻⁹, PCON-WES = 6.39 × 10⁻⁶; Mucispirillum: PCAL-WES = 1.47 × 10⁻⁸, PCON-WES = 2.22 × 10⁻¹¹).#Supplementary Data 5 shows statistical analysis of all taxa including low abundant taxa (“others”) across different diets. b Violin plots depicting alpha diversity indices of bacterial standing communities in mice. The lines in the violin plot from bottom to top indicate 1st QR, median, and 3rd QR. The tips of the violin plot represent minima and maxima, and the width of the violin plot shows the frequency distribution of the data. c Capscale plot of the BrayCurtis distance depicting beta diversity of bacterial standing communities in mice. d Differentially abundant microbial taxa of bacterial standing communities identified by the LEfSe algorithm in CAL- (blue), CON (gray), and WES- (red) mice. The root represents the fungal domain and the size of each node corresponds to the relative abundance of the taxon. e Cladogram depicting bacterial indicator species among standing communities for each diet. Statistical significance in panel a was determined using Kruskal–Wallis test followed by two-sided Mann–Whitney U test adjusted by FDR correction. In panel b statistical significance was determined using one-way ANOVA on residuals after sex and generation adjustment followed by Tukey’s multiple comparisons test.*Padj < 0.05, **Padj < 0.01, ***Padj < 0.001. Data in panel c was analyzed using “anova.cca” function (999 permutations) followed by “MANOVA.RM” for post hoc analysis. Source data for a–d are provided as a Source Data file.

