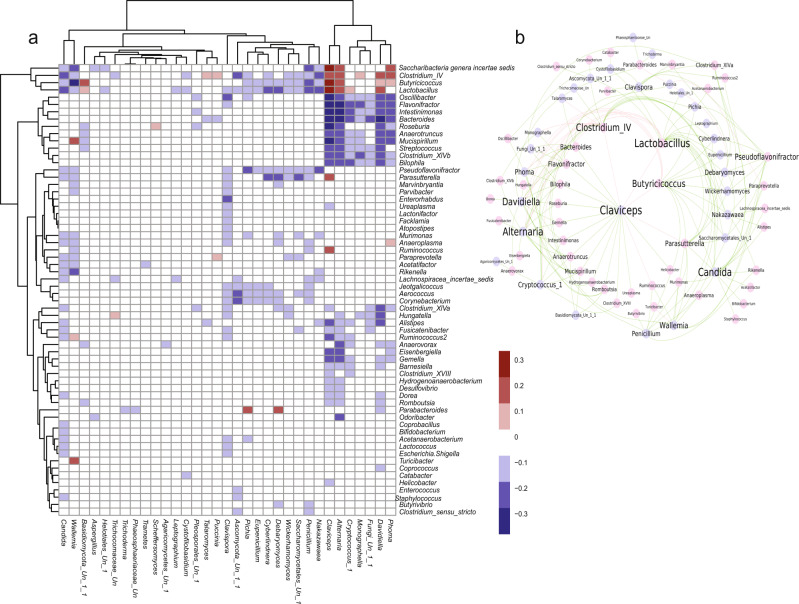
Fig. 3. Interaction network between microbial standing communities and fungi in the gut of AIL mice.
a Heatmap demonstrating significant (Padj < 0.05) correlations between fungal genera (columns) abundances and bacterial genera (rows) abundances (standing communities). The color codes of the cells indicate either positive (purple) or negative (orange) correlations among the species (Padj < 0.05); n = 419 samples were used for the correlation analysis. b Interaction network demonstrating conserved correlations (interaction that is present for both standing and active communities; Padj < 0.05) between bacterial standing communities (pink nodes) and fungal (blue nodes) taxa. The size of the font indicates the key driving taxa, which are characterized as taxa with the highest number of associations with taxa from the other domain. Positive correlations are denoted in red and negative correlations are denoted in green. Data in a, b were calculated using FastSpar implementation of the FastCC algorithm (n = 999 permutations). P-value were adjusted using Benjamini–Hochberg correction. Source data are provided as a Source Data file.

