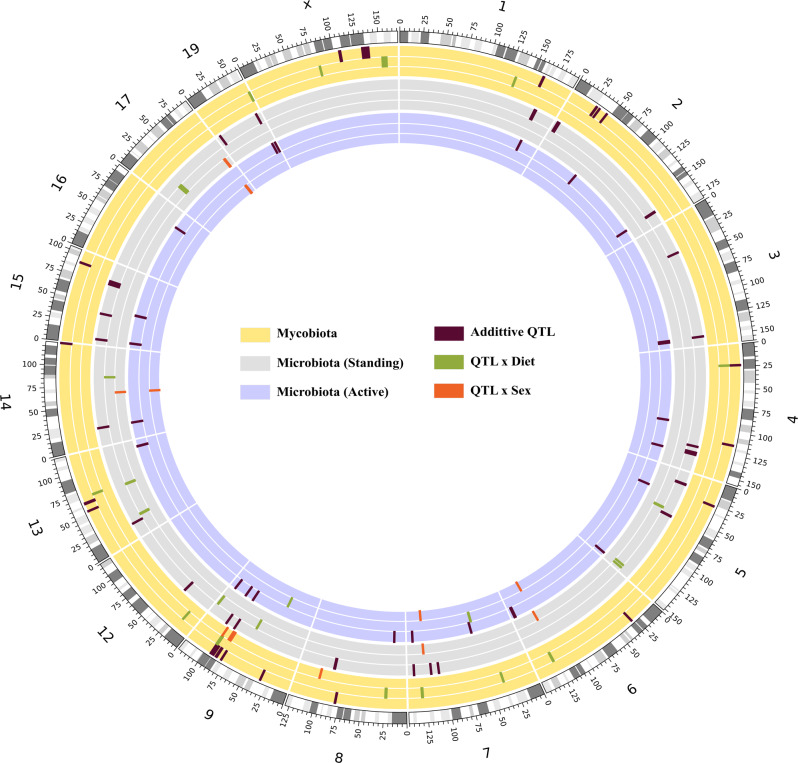
Fig. 4. Gut fungal and bacterial QTL in AIL mice.
Circos plot showing QTL (αgw < 0.05) in AIL mice associated with bacteria (standing and active community) and fungi as traits. The outer most circle in the circos plot describes chromosomes with cytogenic bands in the C57BL/6J mouse genome (reference mouse assembly mm10). Every circle within each chromosome is color coded for fungi (yellow), bacterial standing communities (gray) and bacterial active communities (purple) describing the three models i.e., additive (Add), interaction with diet (IntDiet), and interaction with sex (IntSex) from outwards to inwards. The QTL, marked as rectangles, with brown color represent the additive model, while the green color and the red color represent diet- and sex-interacting QTL, respectively. Note, only chromosomes in which QTL were detected are shown. QTL, quantitative trait loci.

