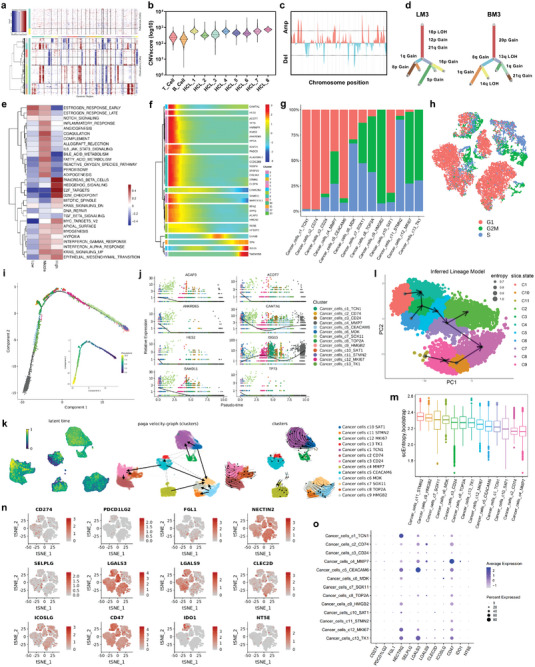
Figure 3.

Copy number variation (CNV) and clonal evolution analysis of metastatic breast cancer cells. a) Hierarchical heatmap showing large‐scale CNVs of cancer cells and T/B cells from liver and brain metastases of breast cancer. T/B cells were included as a control reference. Red: gains; blue: losses. b) Eight clusters of cancer cells (HCL1‐8) were identified with similar copy number alterations. The log‐transformed CNV score was used to compare the CNVs of each cluster to those of T cells and B cells. c) CNVs were inferred according to the spanning position of each chromosome (x‐axis). d) Clonality trees of the single cancer cells. The branches are delineated according to the percentage of cells in the subclone containing the corresponding CNVs. e) GSVA was performed to compare the differences in pathways in cells with low, median, and high CNV scores. The Z score was used to normalize each column. f) The differentially expressed genes and pseudotime curve are shown in a hierarchical heatmap. g) The percentage of cancer cells in the G1, G2M, and S phases in each cell cluster. The G1 phase was defined as noncycling, and the G2M and S phases were defined as cycling states. h) t‐SNE plot showing the cancer cells in the G1, G2M, and S phases. i) Monocle pseudotime trajectory analysis of cancer cells with highly variable genes. Each dot on the pseudotime curve represents one single cell and is colored according to its cluster label. j) The expression of the most variable genes involved in the cancer cell state transition is shown. k) RNA velocity analysis was performed to investigate the developmental lineages and cellular dynamics of cancer cells. l,m) The entropy of gene expression based on single‐cell RNA expression profiles was explored by the SLICE algorithm to assess and score the stemness of each cancer cell cluster. n) Feature plots showing the normalized expression of immune checkpoint genes in each cancer cell. o) Dot plot showing the expression level of immune checkpoint genes in each cancer cell subcluster.
