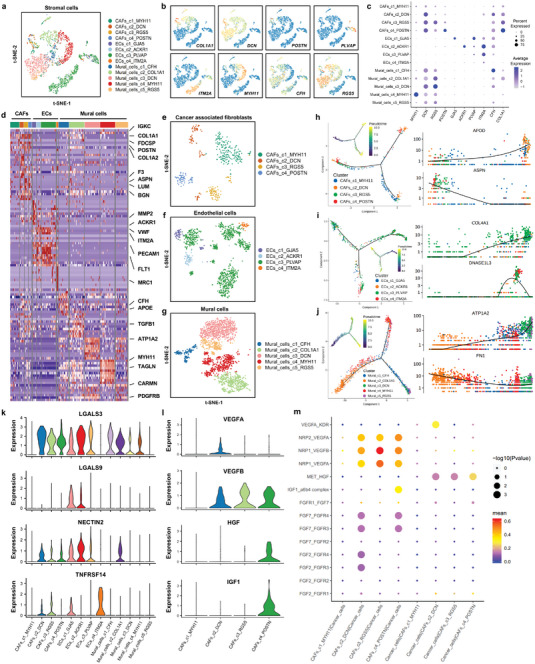
Figure 6.

Diversity of cancer‐associated fibroblasts (CAFs), endothelial cells (ECs) and mural cells (MCs) in the tumor microenvironment. a) t‐SNE plot of the stromal cell landscape colored by subcluster. b) Feature plots showing the normalized expression of canonical marker genes in each stromal cell subcluster. c) Dot plot showing the expression level of canonical marker genes across all stromal cell subtypes. d) Heatmap of the expression levels of the top 10 differentially expressed genes among the four subclusters of stromal cells. e) Reclustering of cancer‐associated fibroblasts (CAFs) and visualization of the profile of each subtype via a t‐SNE plot. f) Monocle pseudotime trajectory analysis of CAFs with highly variable gene expression. Each dot on the pseudotime curve represents one single cell and is colored according to its cluster label. g) Reclustering of endothelial cells (ECs) and visualization of the profile of each subtype via a t‐SNE plot. h) Monocle pseudotime trajectory analysis of ECs with highly variable gene expression. Each dot on the pseudotime curve represents one single cell and is colored according to its cluster label. i) Reclustering of mural cells (MCs) and visualization of the profile of each subtype via a t‐SNE plot. j) Monocle pseudotime trajectory analysis of MCs with highly variable gene expression. Each dot on the pseudotime curve represents one single cell and is colored according to its cluster label. k) Violin plot showing the expression levels of immune checkpoint genes (LGALS3, LGALS9, NECTIN2, and TNFRSF14) in each stromal cell subtype. l) Violin plot showing the expression levels of cell growth factor genes (VEGFA, VEGFB, HGF, and IGF1) in stromal cell subtypes. m) Dot plot showing the ligand–receptor pairs of cell growth factors between cancer cells and each CAF cluster predicted by the CellphoneDB 2 method.
