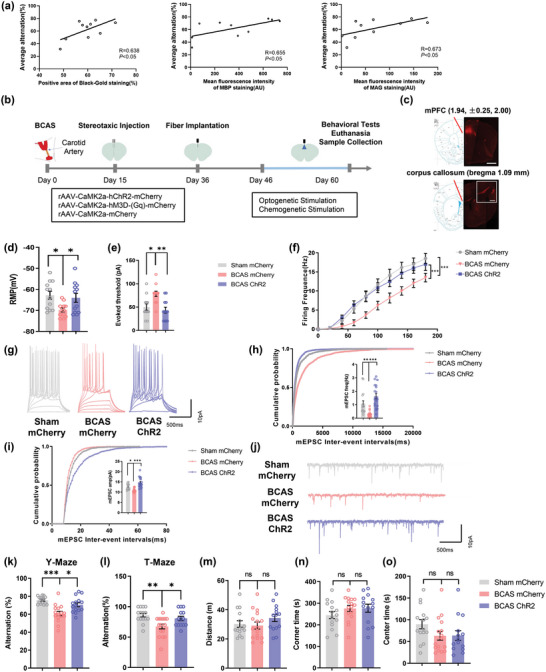
Figure 1.

Optogenetic stimulation alleviates WMI‐related cognitive impairment in mice. a) Correlation between white matter injury and cognitive decline 2 months after surgery in BCAS model mice. White matter injury was evaluated by Black‐gold staining and immunofluorescence staining. Cognitive function was evaluated by the T‐maze test and Y‐maze test. The mean spontaneous alternation percentage in the T‐maze and Y‐maze tests was used as an index of cognitive function. n = 10. b) Schematic diagram of stereotaxic injection into BCAS model mice followed by long‐term optogenetic and chemogenetic stimulation. c) rAAV‐CaMKIIα‐mCherry‐WPRE‐hGH pA was injected into the medial prefrontal cortex (mPFC) and was transported to the corpus callosum. Representative confocal images of mCherry expression in the mPFC and corpus callosum. Scale bar: 1 mm (top); 400 µm (bottom). d) The resting membrane potential (RMP), e) action potential (AP) threshold in response to current injection, and f) firing frequency of pyramidal neurons in layer 2/3 of the mPFC in the sham mCherry, BCAS mCherry, and BCAS ChR2 groups at 2 months after surgery. Recordings were acquired from 3 mice per group. n = 12 recordings per group. g) Representative APs of pyramidal neurons in layers 2/3 of the mPFC in the sham mCherry, BCAS mCherry, and BCAS ChR2 groups at 2 months after surgery. The h) frequency and i) amplitude of miniature excitatory postsynaptic currents (mEPSCs) of glutamatergic neurons in the mPFC in the sham mCherry, BCAS mCherry, and BCAS ChR2 groups at 2 months after surgery. Recordings were acquired from 3 mice per group. n = 16–18 recordings per group. j) Representative mEPSCs of glutamatergic neurons in the mPFC in the sham mCherry, BCAS mCherry, and BCAS ChR2 groups at 2 months after surgery. Results of k) Y‐maze and l) T‐maze tests showing the spontaneous alternation percentage, defined as the proportion of times that a mouse entered all three arms consequently and the proportion of times a mouse entered the correct goal arm, in the sham mCherry, BCAS mCherry, and BCAS ChR2 groups at 2 months after surgery. n = 15–16 per group. Results of the open field test showing m) the total distance travelled and n) time spent in the corner area and o) center area in the sham mCherry, BCAS mCherry, and BCAS ChR2 groups at 2 months after surgery. n = 15–16 per group. The data are presented as the mean ± SEM. p‐values were determined by Pearson's rank correlation in (a); by the Kruskal–Wallis test with Dunn's post‐hoc analysis in (e), (h), (k), (m), and (o); by 1‐way ANOVA with Tukey's post‐hoc analysis in (d), (i), (l), and (n); and by 2‐way ANOVA with Tukey's post‐hoc analysis in (f). *p < 0.05, **p < 0.01, ***p < 0.001.
