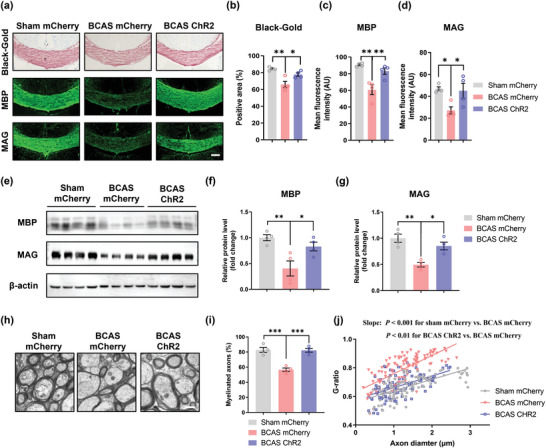
Figure 3.

Optogenetic stimulation promotes myelin repair in mice. a) Representative images of Black‐gold staining and immunostaining of MBP and MAG in the corpus callosum in the sham mCherry, BCAS mCherry, and BCAS ChR2 groups at 2 months after surgery. Scale bar: 200 µm. Quantification of b) Black‐gold staining and immunostaining of c) MBP and d) MAG in the corpus callosum in the sham mCherry, BCAS mCherry, and BCAS ChR2 groups at 2 months after surgery. n = 4 per group. e) Immunoblot bands and quantification of f) MBP and g) MAG expression in the corpus callosum in the sham mCherry, BCAS mCherry, and BCAS ChR2 groups at 2 months after surgery. The intensity of each immunoblot band was normalized to that of the β‐actin band. The measured values were normalized to the mean value of the sham group. n = 4 per group. h) Representative TEM images of the corpus callosum in the sham mCherry, BCAS mCherry, and BCAS ChR2 groups at 2 months after surgery. Scale bar: 1 µm. i) The percentage of myelinated axons in the corpus callosum in the sham mCherry, BCAS mCherry, and BCAS ChR2 groups at 2 months after surgery. n = 4 per group. j) Scatterplots of the myelin g‐ratio as a function of the axon diameter in the corpus callosum in the sham mCherry, BCAS mCherry, and BCAS ChR2 groups at 2 months after surgery. Axons were selected from 4 mice per group for measurement. n = 114, n = 115, and n = 105 measured axons for each group. The data are presented as the mean ± SEM. p‐values were determined by 1‐way ANOVA with Tukey's post‐hoc analysis in (b), (c), (d), (f), (g) and (i) and by the Kruskal–Wallis test with Dunn's post‐hoc analysis in (j). *p < 0.05, **p < 0.01, ***p < 0.001.
