
Figure 5.
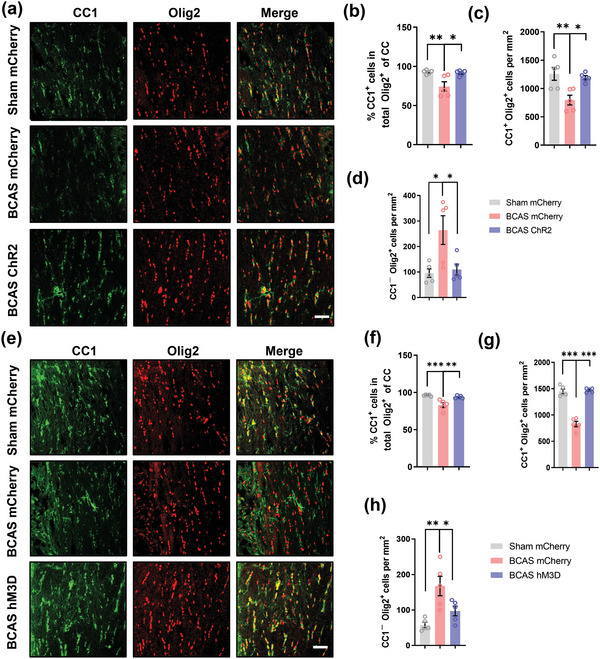
Stimulation of prefrontal cortex neurons drives oligodendrocyte differentiation. a) Representative immunostaining of CC1 and Olig2 in the corpus callosum in the sham mCherry, BCAS mCherry, and BCAS ChR2 groups at 2 months after surgery. Scale bar: 50 µm. b) Proportion of CC1+/Olig2+ cells in the corpus callosum in the sham mCherry, BCAS mCherry, and BCAS ChR2 groups at 2 months after surgery. n = 5 per group. Density of c) CC1+Olig2+ cells and d) CC1−Olig2+ cells in the corpus callosum in the sham mCherry, BCAS mCherry, and BCAS ChR2 groups at 2 months after surgery. n = 5 per group. e) Representative immunostaining of CC1 and Olig2 in the corpus callosum in the sham mCherry, BCAS mCherry, and BCAS hM3D groups at 2 months after surgery. Scale bar: 50 µm. f) Proportion of CC1+/Olig2+ cells in the corpus callosum in the sham mCherry, BCAS mCherry, and BCAS hM3D groups at 2 months after surgery. n = 5 per group. Density of g) CC1+Olig2+ cells and h) CC1−Olig2+ cells in the corpus callosum in the sham mCherry, BCAS mCherry, and BCAS hM3D groups at 2 months after surgery. n = 5 per group. The data are presented as the mean ± SEM. p‐values were determined by 1‐way ANOVA with Tukey's post‐hoc analysis in (b–d) and (f–h). *p < 0.05, **p < 0.01, ***p < 0.001.