Figure 6.

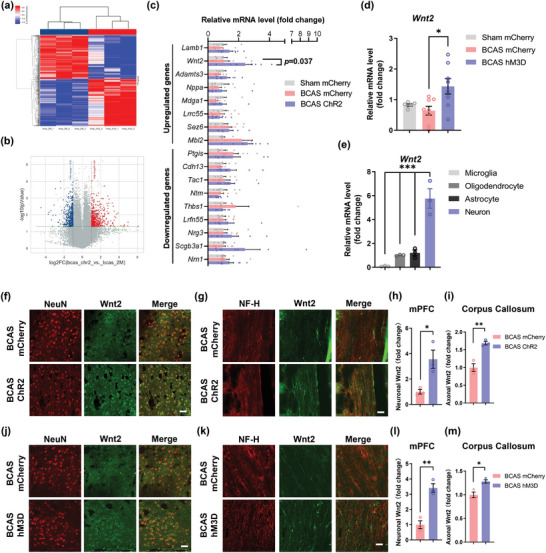
Activation of glutamatergic neurons in the mPFC upregulates Wnt2 expression in the corpus callosum. a) Heatmap of the results of mPFC tissue microarray analysis between the BCAS mCherry and BCAS ChR2 groups at 2 months after surgery. n = 3 per group. b) Volcano plot of the results of mPFC tissue microarray analysis between the BCAS mCherry and BCAS ChR2 groups at 2 months after surgery (fold change > 2; p < 0.05). The DEGs are listed. n = 3 per group. c) Real‐time PCR for validation of the identified DEGs among the sham mCherry, BCAS mCherry, and BCAS ChR2 groups at 2 months after surgery. n = 7–8 per group. d) Real‐time PCR analysis of Wnt2 expression in the mPFC in the sham mCherry, BCAS mCherry, and BCAS hM3D groups at 2 months after surgery. n = 7–8 per group. e) Real‐time PCR analysis of Wnt2 expression in different types of primary cortical neural cells. n = 3 per group. f) Representative immunostaining of NeuN and Wnt2 in the mPFC in the sham mCherry, BCAS mCherry, and BCAS ChR2 groups at 2 months after surgery. Scale bar: 50 µm. g) Representative immunostaining of NF‐H and Wnt2 in the corpus callosum in the sham mCherry, BCAS mCherry, and BCAS ChR2 groups at 2 months after surgery. Scale bar: 35 µm. Quantification of immunostaining of Wnt2 in the h) mPFC and i) corpus callosum in the sham mCherry, BCAS mCherry, and BCAS ChR2 groups at 2 months after surgery. The fluorescence intensity in each image was normalized to that of NeuN and NF‐H. The measured values were normalized to the mean value of the BCAS group. n = 3 per group. j) Representative immunostaining of NeuN and Wnt2 in the mPFC in the sham mCherry, BCAS mCherry, and BCAS hM3D groups at 2 months after surgery. Scale bar: 50 µm. k) Representative immunostaining of NF‐H and Wnt2 in the corpus callosum in the sham mCherry, BCAS mCherry, and BCAS hM3D groups at 2 months after surgery. Scale bar: 35 µm. Quantification of Wnt2 immunostaining in the l) mPFC and m) corpus callosum in the sham mCherry, BCAS mCherry, and BCAS hM3D groups at 2 months after surgery. The fluorescence intensity in each image was normalized to that of NeuN and NF‐H. The measured values were normalized to the mean value of the BCAS group. n = 3 per group. The data are presented as the mean ± SEM. p‐values were determined by the Kruskal–Wallis test with Dunn's post‐hoc analysis in (d); by 1‐way ANOVA with Tukey's post‐hoc analysis in (c) and (e); and by Student's t‐test in (h), (i), (l), and (m). *p < 0.05, **p < 0.01.
